Thank you for your interest in Refeyn’s mass photometry technology
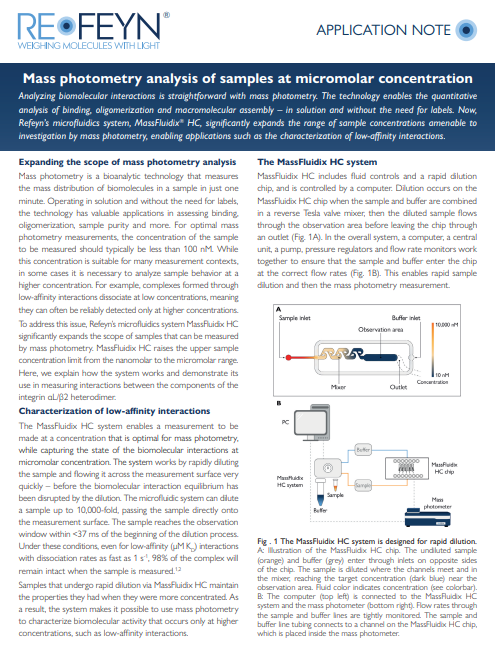
Application note: Mass photometry analysis of low-affinity protein interactions
Learn how mass photometry facilitates the analysis of biomolecular interactions, enabling the characterization of protein binding, oligomerization and macromolecular assembly –all in a label-free, solution-based approach. Find out how you can significantly broaden the sample concentration range for your mass photometry analysis with the mass photometry add-on MassFluidix HC. Discover how the system’s rapid dilution function allows you to expand the range of sample concentrations you can analyze with mass photometry, ultimately enabling you to explore and characterize low-affinity interactions that were previously challenging to study.
Additional resources
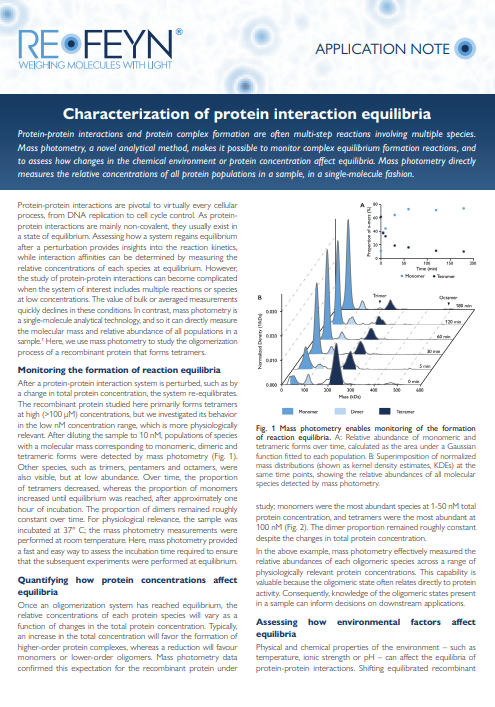
APPLICATION NOTE: Characterization of protein interaction equilibria
Learn how mass photometry can be applied to the study of complex equilibrium formation and assess how changes in the chemical environment or protein concentration affect the equilibria. More specifically, discover how mass photometry was used to study the oligomerization process of a recombinant protein that forms tetramers. Using this multimeric protein as an example, you can see how scientists measured the relative abundances of each oligomeric species across a range of physiologically relevant protein concentrations and assessed the effect of environmental factors (such as temperature) on reaction equilibria.

APPLICATION NOTE: Quantifying protein binding affinities using mass photometry
Learn how mass photometry can be used to assess the dynamics and strength of protein-protein interactions. Discover how it can be used to characterize interactions between Immunoglobulin G (IgG) antibodies of different origin species (human and bovine) and protein A, by quantifying the relative abundance of each protein and the complexes they form in solution. Gain insights on how the automated pipetting feature of Refeyn’s TwoMP Auto mass photometer generates highly reproducible data. Finally, learn how you can calculate the equilibrium dissociation constant (KD) for each protein interaction from mass photometry data.
Ready to revolutionize your research?
Find out how mass photometry can transform your sample characterization. Whether you’re focused on drug development, discovery science, or manufacturing, Refeyn’s innovative technology provides the insights you need to accelerate your breakthroughs.