Next-generation chemogenetic inhibition using a brain-permeant non-prescription agentDevenish, Patel, Ussingkær
et alSignal Transduct Target Ther (2026) 11 (1)
DOI: 10.1038/s41392-026-02865-4Snippet: Gel Doc XR molecular imager using Image Lab software (Bio-Rad). The percentages of empty and full capsids were estimated in viral vector samples diluted to around 1011 vg/mL in PBS using a SamuxMP mass photometer (Refeyn). Counts for empty and full capsids were given by the nearest peak to 3.7 MDa and 5.0 MDa, respectively. Particles with masses of <2 MDa were defined as protein impu
Methods to Study the Molecular Mechanism and Drive the Design of Protein DegradersCrowe, Ciulli
Chem Rev (2026) 126 (10), 5755-5791
DOI: 10.1021/acs.chemrev.5c00800 Cited by 5
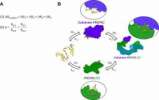
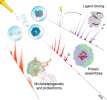
Snippet: can determine whether ternary complexes have formed and evaluate mono- and multimeric protein ensembles, for example, size-exclusion chromatography (SEC), electrophoretic mobility shift assay (EMSA), mass photometry, and native mass spectrometry (Figure ). These methods inform on a change in molecular weight consistent with a;- C Schematic of a Gaussian-fitted mass photometry histogram showing a rightward shift in molecular size on ternary complex formation. …
High-Resolution Native Mass SpectrometryTamara, den Boer, Heck
Chem Rev (2022) 122 (8), 7269-7326
DOI: 10.1021/acs.chemrev.1c00212 Cited by 519
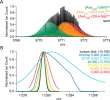
Snippet: … Using mass photometry in parallel with native MS may be of assistance here. In this context, Sonn-Segev et al.258 studied the stability of the proteasome purified from bovine heart tissue by mass photometry and observed distinct 2.4 MDa 30S particles (two regulatory particles and one core particle) and 1.5 MDa 26S particles (one regulatory particle and one core particle) as well as the 70;Using mass photometry in parallel with native MS may be of bovine heart tissue by mass photometry and observed distinct 2.4 under varying conditions by mass photometry may help to
Scattering-based Light Microscopy: From Metal Nanoparticles to Single ProteinsPriest, Peters, Kukura
Chem Rev (2021) 121 (19), 11937-11970
DOI: 10.1021/acs.chemrev.1c00271 Cited by 130
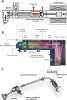
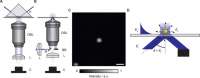
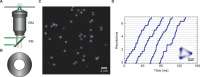
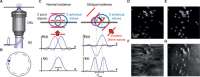
Snippet: … In addition, single particle detection allows much improved characterization of sample hetero/homogeneity compared to methods providing average particle size only. 4.4 Mass Photometry At the very extremes of sensitivity, iSCAT has been used to detect, image, localize, and track individual proteins in a label-free fashion.32,33,162,163 The interferometric contrast ge;The increased need for sample stage stability and overall suppression of low-frequency environmental noise resulted in the evolution of a robustly enclosed mass photometer from;This level of accuracy was a desirable aspect of mass photometry (MP) because it dramatically simplifies the identification of unlabeled species by mass, enabling more highly
A prophage-encoded abortive infection protein preserves host and prophage spreadSargen, Antine, Grabe
et alNature (2026)
Cited by 8
Snippet: Ratiometric contrast measurements were converted to molecular weight measurements using DiscoverMP software (Refeyn). Automatic gaussian curve fitting was;- AcquireMP software (Refeyn) was used to find focus on gel filtration buffer only, then β-amylase and thyroglobin control or samples were diluted in the buffer 1:10 followed;- The oligomeric state of HepS, trigger peptide–HepS H105A co-complex and HepS oligomerization mutants were determined by mass photometry (TwoMP, Refeyn).;- Mass photometry analysis confirmed that HepS forms a stable tetramer in solution (Extended Data Fig. 1g). HEPN proteins typically function as dimers that bring together;- AcquireMP software (Refeyn) was used to find focus on gel filtration buffer only, then (Refeyn). …
Bacterial immune activation via supramolecular assembly with phage triggersZhang, Lyu, Beck
et alNature (2026)
Cited by 9
Snippet: Data were acquired by AcquireMP and analysed by DiscoverMP software. The recorded events were fitted to Gaussian distributions, and masses were calculated by;- Of each protein, 2 μl was added to 18 μl of buffer in the well, and measured using a Refeyn TwoMP mass photometer (Refeyn) with a data acquisition time of 60 s. Data;- 3a), and mass photometry analysis revealed a dominant species of approximately 1.4 MDa (Extended Data Fig. 3b), indicating a large supramolecular complex.
Metabolite glues as a means of purine sensing and chemotherapeutic responseWitus, Kober, Roh
et alNature (2026) 655 (8125), 1300-1308
DOI: 10.1038/s41586-026-10790-3 Cited by 3
Snippet: mediately measured using a Refeyn Mass Photometer TwoMP within 10 s of dilution with a normal viewing window and 1-min recording time using AquireMP software (Refeyn). Data were processed using the MassFerence P1 standards for mass estimation (Refeyn, MP-CON-41033) and figures were assembled in the DiscoverMP software (Refeyn). All mass photometry measurements were repeated at least twice in ind;nditions containing only PPAT or NUDT5 were assembled at 1 μM of protein component. Binding reactions were rapidly diluted in binding buffer and immediately measured using a Refeyn Mass Photometer TwoMP within 10 s of dilution with a normal viewing window and 1-min recording time using AquireMP software (Refeyn). Data were processed using the MassFerence P1 standards for mass estimation (Refe;g window and 1-min recording time using AquireMP software (Refeyn). Data were processed using the MassFerence P1 standards for mass estimation (Refeyn, MP-CON-41033) and figures were assembled in the DiscoverMP software (Refeyn). All mass photometry measurements were repeated at least twice in independent experiments.Mass-spectrometry-based metabolomics;measurement. … Binding reactions were rapidly diluted in binding buffer and immediately measured using a Refeyn Mass Photometer TwoMP within 10 s of dilution with a normal viewing window and 1-min recording time using AquireMP software (Refeyn). Data were processed using the MassFerence P1 standards for mass;sample measurement. … Binding reactions were rapidly diluted in binding buffer and immediately measured using a Refeyn Mass Photometer TwoMP within 10 s of dilution with a normal viewing window and 1-min recording time using AquireMP software (Refeyn). Data were processed using the MassFerence P1 standards fo;absence and presence of AMP. …d, Mass photometry of PPAT–NUDT5 complexes with the indicated metabolite treatments. …
A biased allosteric modulator is a molecular glue for β2AR dimerizationShen, Peddada, Komolov
et alNature (2026)
Cited by 2
Snippet: Family A G-protein-coupled receptors (GPCRs) are typically described as monomers, yet growing evidence suggests that they can form dimers with distinct signalling;- Family A G-protein-coupled receptors (GPCRs) are typically described as monomers, yet growing evidence suggests that they can form dimers with distinct signalling;- Mass photometry measurements were performed using a Refeyn TwoMP instrument (Refeyn) and the AcquireMP software (v.2.3) according to an established protocol 57 .;- Mass photometry analysis of diluted dimer samples in detergent confirmed the presence of a significant fraction of tetramer in solution (Extended Data Fig. 7d–f).;- were performed using a Refeyn TwoMP instrument (Refeyn) and the AcquireMP mass determination were performed using the DiscoverMP software suite (Refeyn)
An ancient mitochondrial program tunes translation to haem availabilityZhang, Schuler, Çetin
et alNature (2026)
Snippet: …It arises;- was adjusted by applying 10 µl mass photometry buffer (30 mM HEPES pH mass photometry buffer to a final concentration of 50 nM immediately before mass photometry;- Measurements were performed using a TwoMP mass photometer (Refeyn). Before each measurement, the focus was adjusted by applying 10 µl mass photometry buffer (;- Measurements were performed using a TwoMP mass photometer (Refeyn). Before each analysed using Refeyn AcquireMP 2.3 and Refeyn DiscoverMP 2.3, respectively






























.svg "Stanford University")