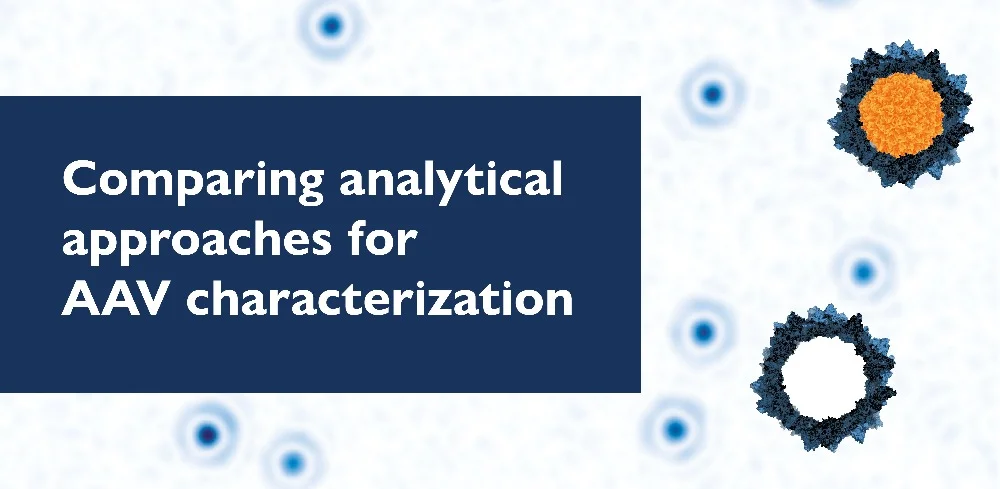
Understanding the strengths and boundaries of mass photometry 2025

This post was first published in October 2021

Updated on June 2025 

Mass photometry is an analytical method that measures molecular mass by quantifying light scattering from individual biomolecules and particles in solution. It was introduced in a 2018 publication in the journal Science (Young et al., 2018). Since then, more and more scientists have been turning to mass photometry to analyze sample purity, interactions, aggregation and much more. Fast, versatile and easy to use, it has now been adopted by hundreds of labs around the world and referenced in over 1000 scientific publications

If you are evaluating mass photometry as a potential technology for your lab, you will first want to assess whether its capabilities align with your sample types and needs 

Here, we describe mass photometry’s mass range, resolution and experimental error, and the concentration ranges that can be analyzed. 

Mass range

Because mass photometry simply measures light scattering, it should be possible to measure any particle within the appropriate mass range. Indeed, the technique has been used to study samples containing a diverse range of different biomolecules and other particles, such as: 

With the TwoMP mass photometer, you can reliably measure molecular mass in the range from 30 kDa to 5 MDa (Fig. 1). The range of the SamuxMP mass photometer, which is optimized for AAV analysis, is 500 kDa to 6 MDa. A related technology, macro mass photometry, can be used to analyze particles of diameter in the 40 – 150 nm range, such as adenovirus, lentivirus and virus-like particles (VLPs).  

Mass-photometry-technologies-range-6MDa resized

Figure 1:  Diagram illustrating the mass range and examples of particles that can be analyzed with mass photometry and macro mass photometry 


Resolution

Resolution, in mass photometry, is the smallest difference in mass that you can detect in a mass photometry measurement. In other words, it is the smallest difference in mass that resolves as two distinguishable peaks in a mass photometry histogram.  

There is no single value that defines the resolution of mass photometry because it depends on several factors, including:   

  • The mass range of the particles of interest,  
  • The purity of the sample, and  
  • The relative concentrations of species in the sample.  

We can take the TwoMP mass photometer as an example to illustrate how the minimum separable distance increases for species with greater mass. At the lower end of the mass range, the resolution is ± 25 kDa for a measurement of a 66 kDa biomolecule (defined as the Full Width of the peak at its Half Maximum value, or FWHM). This means that you could identify other species present in the sample if they were smaller than 41 kDa or larger than 91 kDa (Fig. 2, top panel). These different species would be visible as distinguishable peaks in the mass histogram obtained from a mass photometry measurement. On the other hand, if all species in the sample were within the range 41 – 66 kDa (or 66 – 91 kDa), only one broad peak would be observed, and it would be made up of counts from all the different species.  

At the higher end of the mass range, for example around 660 kDa, the resolution is ± 60 kDa FWHM. This means that you would be able to distinguish 660 kDa particles from others if their mass were ≤ 600 kDa or ≥ 720 kDa (Fig. 2, bottom panel).  

In doubt about whether mass photometry could resolve your species of interest? Get in touch!  

Resolution mass photometry explanation print

Figure 2 Resolution in mass photometry. Top: The peaks of two proteins in the lower mass range are resolved. Bottom: A mass histogram for the protein thyroglobulin is used to illustrate the resolution and FWHM in the 500 – 800 kDa mass range. 

Resolution also depends on sample purity, as well as on the relative concentrations of the species in the sample. For resolution, it is optimal to have equal peak heights. In this case, two peaks can be resolved when the separation between their centers is larger than the sum of half their full width at half maximum (FWHM), as described above. But when one species is much more abundant than another, the minimum separation distance increases. Where impurities are present within the mass window of interest or there is significant sample heterogeneity, these factors can also negatively affect the resolution of a mass photometry measurement.   

In summary, mass photometry resolution varies across the mass range and can be affected by the composition and quality of a sample. 


Experimental error

Mass photometry measures molecular mass with high accuracy. However, as with all analytical methods, you must be aware of possible experimental error.   

A single mass photometry measurement comes with a measurement error of up to ± 5% (for Refeyn mass photometers), meaning that the molecular mass measured by mass photometry might deviate from the expected molecular mass by ± 5% (Fig. 3). The peaks in a mass photometry histogram can be fitted using Gaussian approximations, with the peak center indicating the measured mass of the species. This experimental error arises from a combination of sources, including sample measurement error, calibrant measurement error and error in fitting a Gaussian curve to the raw data. The error can be reduced by taking the average of repeated measurements. 

Expected vs measured Mass error print 2

Figure 3 Accuracy of mass photometry. Top: Correlation of expected vs. measured molecular mass (in kDa) for a set of proteins across the 60 – 1000 kDa mass range. Bottom: Mass error shown as a percentage of the expected mass (N=150). Measured on a OneMP mass photometer


Sample concentration range

Mass photometry measures the mass of single particles as they land on a glass measurement surface. To ensure that the landing events are well separated in space and time, it is essential to prepare samples to the appropriate concentration. Mass photometry can be performed with sample concentrations ranging from 100 pM to 100 nM, with the optimal concentration range for biomolecules being 5 – 20 nM for proteins or nucleic acid molecules, and 1011 particles/mL for AAVs.    

Being able to run mass photometry experiments at such low sample concentrations can be a great advantage when limited sample is available. However, when higher concentrations need to be used, such as if you are studying weak biomolecular interactions of molecular species, a rapid-dilution microfluidics add-on (Refeyn’s MassFluidixTM) can make it possible to measure samples at up to the tens of micromolar.   


Further resources 

Blog: How does mass photometry work?  

Read our technical blog explaining the principle behind mass photometry, how the technology works and what makes it so useful. 

Handbook: Understanding Mass Photometry 

Download this handbook for a complete overview of mass photometry – from basics to applications. Everything you need to know to understand how the technology works and how it can be used, all in one place.  

Webinar: Mastering protein characterization with mass photometry: Key insights & applications by Tomás de Garay, Refeyn 

Watch this webinar to learn how how mass photometry is transforming protein characterization. It includes a brief introduction to the technology, its applications and how it compares to analytical techniques like cryo-EM, SEC and mass spectrometry, as well as answers to technical questions and practical considerations. Presented by Tomás de Garay, Product Manager at Refeyn.  


References

Balakrishnan, S. et al. Structure of RADX and mechanism for regulation of RAD51 nucleofilaments. Proc. Natl. Acad. Sci. 121, e2316491121 (2024). https://www.pnas.org/doi/10.1073/pnas.2316491121  

Cramer, D. A. T. et al. Characterization of high-molecular weight by-products in the production of a trivalent bispecific 2+1 heterodimeric antibody. mAbs 15, 2175312 (2023). https://doi.org/10.1080/19420862.2023.2175312  

De Vos, J. et al. Evaluation of size-exclusion chromatography, multi-angle light scattering detection and mass photometry for the characterization of mRNA. J. Chromatogr. A 1719, 464756 (2024). https://doi.org/10.1016/j.chroma.2024.464756  

den Boer, M. A. et al. Comparative Analysis of Antibodies and Heavily Glycosylated Macromolecular Immune Complexes by Size-Exclusion Chromatography Multi-Angle Light Scattering, Native Charge Detection Mass Spectrometry, and Mass Photometry. Anal. Chem. 94, 892–900 (2021).  https://pubs.acs.org/doi/10.1021/acs.analchem.1c03656  

Dodge, G. J. et al. Mapping the architecture of the initiating phosphoglycosyl transferase from S. enterica O-antigen biosynthesis in a liponanoparticle. eLife 12, RP91125 (2024). https://doi.org/10.7554/eLife.91125.2  

Ebberink, E. H. T. M. et al. Probing recombinant AAV capsid integrity and genome release after thermal stress by mass photometry. Mol. Ther. Methods Clin. Dev. 32, (2024).  https://doi.org/10.1016/j.omtm.2024.101293    

Naftaly, A., Izgilov, R., Omari, E. & Benayahu, D. Revealing Advanced Glycation End Products Associated Structural Changes in Serum Albumin. ACS Biomater. Sci. Eng. 7, 3179–3189 (2021). https://doi.org/10.1021/acsbiomaterials.1c00387  

Olerinyova, A. et al. Mass Photometry of Membrane Proteins. Chem 7, 224–236 (2021). https://www.sciencedirect.com/science/article/pii/S2451929420305945  

Schmudlach, A., Spear, S., Hua, Y., Fertier-Prizzon, S. & Kochling, J. Mass photometry as a fast, facile characterization tool for direct measurement of mRNA length. Biol. Methods Protoc. 10, bpaf021 (2025). https://doi.org/10.1093/biomethods/bpaf021  

Wagner, C., Fuchsberger, F. F., Innthaler, B., Lemmerer, M. & Birner-Gruenberger, R. Quantification of Empty, Partially Filled and Full Adeno-Associated Virus Vectors Using Mass Photometry. Int. J. Mol. Sci. 24, 11033 (2023). https://www.mdpi.com/1422-0067/24/13/11033  

Wu, D., Hwang, P., Li, T. & Piszczek, G. Rapid Characterization of AAV gene therapy vectors by Mass Photometry. Preprint at https://doi.org/10.1101/2021.02.18.431916 (2021). https://www.nature.com/articles/s41434-021-00311-4  

Wu, D. & Piszczek, G. Measuring the affinity of protein-protein interactions on a single-molecule level by mass photometry. Anal. Biochem. 592, 113575 (2020). https://www.sciencedirect.com/science/article/abs/pii/S0003269719311686?via%3Dihub  

Young, G. et al. Quantitative mass imaging of single biological macromolecules. Science 360, 423–427 (2018). https://www.science.org/doi/10.1126/science.aar5839