This post was first published in September 2021
Updated on 8th May 2025
Mass photometry is a bioanalytical technology that measures the mass of individual biomolecules or particles in solution by quantifying light scattering.
What is the principle behind mass photometry?
The principle behind mass photometry is simple: A single molecule on a measurement surface (e.g. a glass coverslip) exposed to a beam of light produces a small but measurable light scattering signal, which is directly proportional to the molecule’s mass. The greater the mass of the molecule, the more intense the signal (Fig. 1).
Figure 1 Mass photometry concept. A biomolecule (light blue) that is exposed to light (yellow) and placed in a mass photometer generates a light-scattering signal (grey circles beneath the biomolecules). The signal’s intensity is correlated with the molecule’s mass.
In a mass photometry measurement, a sample of proteins (or other biomolecules or particles) is illuminated with a beam of light. Some of that light is reflected by the measurement surface and some is scattered by molecules on the measurement surface (Fig. 2).
Mass photometry measures the interference between the light scattered by the molecule and the light reflected by the measurement surface. The signal measured is called the contrast (or interferometric contrast) and is directly correlated with molecular mass, as demonstrated by the seminal paper introducing mass photometry (Young, et al. 2018).
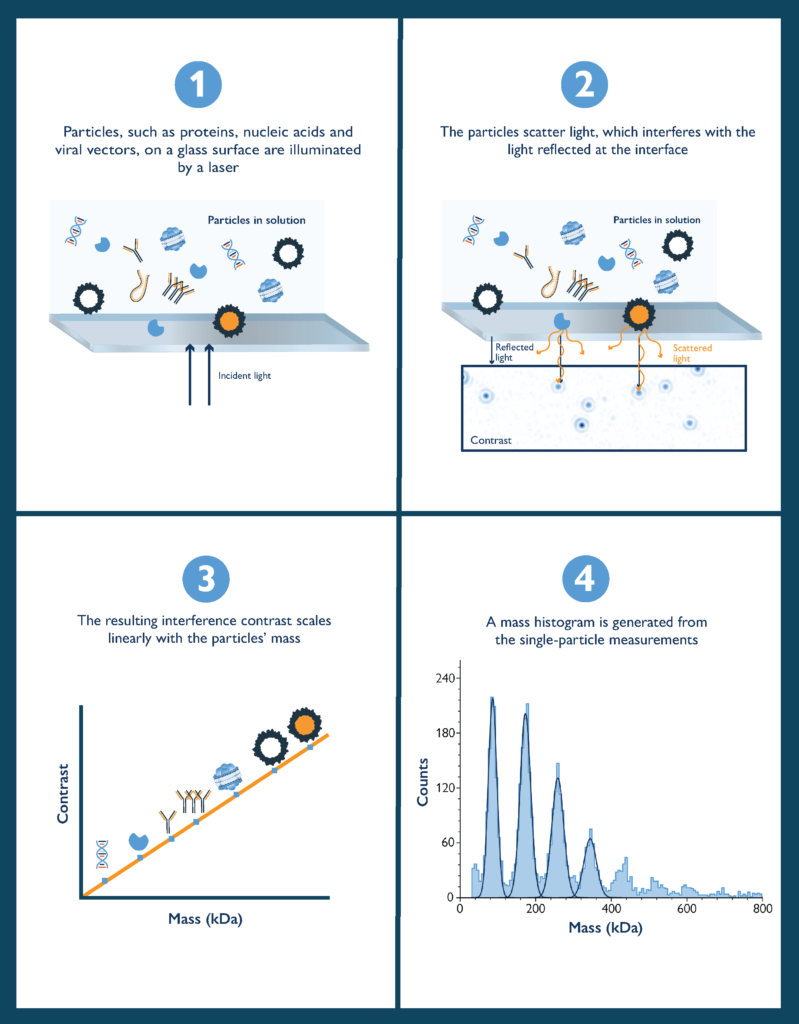
Figure 2 The principle of mass photometry. The light scattered by a molecule in contact with a measurement surface interferes with light reflected by that surface. The interference signal scales linearly with the molecule’s mass.
Why mass photometry is useful
Several valuable benefits set mass photometry apart from other bioanalytical techniques:
- It measures true molecular mass. Mass photometry does not infer the mass indirectly from a different physical parameter. This is different from other techniques, such as dynamic light scattering (DLS) and size-exclusion chromatography (SEC), which infer molecular size from the hydrodynamic radius. Instead, the mass photometry signal measured is directly correlated with the true molecular mass, enabling measurement of the mass of molecules in the range 30 kDa to 6 MDa.
- It shows sample heterogeneity. Mass photometry measures the mass of each molecule or particle on the measurement surface. These single-molecule measurements make it possible to detect subpopulations of species or detail the heterogeneity – aspects of a sample that are invisible to analytical methods that use bulk measurement (such as DLS, SDS-PAGE, analytical ultracentrifugation (AUC) and SEC).
- It works in solution. Mass photometry measurements are performed in solution, and mass photometry is compatible with water as well as a wide range of buffers. Measuring biomolecules in an environment that mimics the intracellular aqueous environment allows their true native behavior to be studied.
- It uses very little sample. Volumes as little as 10 µL can be enough for a single mass photometry measurement, and the recommended concentration range is 100 pM – 100 nM. The low concentration range means that biomolecules can be studied at concentrations that are physiologically relevant – again helping to mimic the intracellular environment and observe native behavior. A rapid-dilution microfluidics device enables measurement of samples at higher concentrations – up to the tens of micromolar.
- It requires no modification of the sample. Mass photometry does not require any labelling of the molecules or particles under investigation. This simplifies sample preparation and eliminates the risk of labels interfering with native behavior.
- It provides results rapidly. Mass photometry workflows are very quick, with both sample preparation and measurement together usually taking just minutes.
- It is easy to use. It takes less than half a day to learn how to do a mass photometry measurement and the data is intuitive to interpret. The instruments also fit conveniently on a lab benchtop.
What types of molecules and particles can you measure with mass photometry?
Mass photometry is a bioanalytical method suitable for measuring the mass of particles in the 30 kDa – 6 MDa mass range, depending on the mass photometer (30 kDa – 5 MDa with the TwoMP, 500 kDa – 6 MDa with the Samux).
Most published studies have applied mass photometry to proteins – to study protein-protein interactions (Higuchi, et al. 2021), protein oligomerization mechanisms (Naftaly, et al. 2021) and characterize protein sample stability (Nuber, et al. 2021).
Mass photometry has also been used successfully to study heteromolecular interactions such as DNA-protein interactions (Hickman, et al. 2020).
Mass photometry can be applied to nucleic acids, enabling the detection and quantification of nucleic acids at sub-picomolar concentrations (Li, et al. 2020) as well as the measurement of the length and integrity of RNA samples (Camperi et al. 2024, Schmudlach et al. 2020).
Mass photometry has also been applied to vesicles and micelles (Lebedeva, et al. 2020), and polysarcosine star polymers for drug delivery (England, et al. 2020).
The linear correlation between the contrast (the signal measured in mass photometry) and molecular mass holds for a wide variety of biomolecules (Young, et al. 2018) – making mass photometry a universal tool for biomolecules and particles in solution. The precise linear relationship between the contrast and mass may differ for each class of molecule, however, requiring calibration with an appropriate standard (e.g. a protein calibrant for measuring proteins, a DNA calibrant for measuring DNA, etc.).
How is mass photometry used?
With mass photometry, you can measure the molecular mass of single biomolecules, oligomers, polymers, macromolecular assemblies, nanostructures and small viral capsids (of e.g. adeno-associated viruses, AAVs).
You can also quantify the oligomerization and aggregation of biomolecules (Naftaly, et al. 2021, Balakrishnan et al. 2024), characterize sample heterogeneity (Olerinyova, et al. 2021, Sonn Segev, et al. 2020), monitor the stability of sample components (Nuber, et al. 2021), and study the effects of molecular or experimental modifications on sample integrity (Bertosin, et al. 2021).
Mass photometry is especially valuable for studying biomolecular interactions – including protein-protein interactions (Higuchi, et al. 2021; Soltermann, et al. 2020) and protein-nucleic acid interactions (Hickman, et al. 2020; Acharya, et al. 2021). Mass photometry makes it possible to determine stoichiometries in biochemical reactions (Xu et al., 2024) , and quantify affinities and rate constants in molecular interactions (Wu and Piszczek 2020; Soltermann, et al. 2020).
Thanks to this versatility, mass photometry is seeing use across a wide range of different applications, such as assessing antibody affinity and aggregation (den Boer et al. 2021, Cramer et al. 2023), characterizing membrane proteins (Olerinyova, et al. 2021, Dodge et al. 2024) and supporting structural studies (Vasquez et al. 2023, Crowe et al. 2024).
Mass photometry is also widely used to characterize AAV samples (Wu, et al. 2021, Wagner et al. 2023, Wagner et al. 2024, Ebberink et al. 2024). Macro mass photometry, a newer technology that builds on the principles of mass photometry, characterizes samples of larger viral vectors (e.g. adenovirus), virus-like particles (VLPs) and lipid nanoparticles (). Wu et al. 2025).
Although mass photometry was introduced relatively recently (in 2018), its range of applications has expanded rapidly as users discover the technology and its versatility. For an up-to-date list of publications citing mass photometry, visit our publications page.
Further resources
If you would like to learn more about the biophysics behind mass photometry, we recommend the following resources:
Webinar: Measuring molecules with light by Prof. Philipp Kukura, University of Oxford
Prof. Kukura, who led the development of mass photometry, explains the principle of mass photometry and talks you through the steps that he and his team of scientists took while developing mass photometry as an analytical tool for biomolecules. You can also hear about examples of mass photometry applications.
Tomás de Garay, Product Manager at Refeyn, describes how mass photometry is transforming protein characterization. He provides a brief introduction to the technology, its applications, and how it compares to analytical techniques like cryo-EM, SEC and mass spectrometry. Tomás then answers questions about technical aspects and practical considerations.
References
Acharya A, Kasaciunaite K, Göse M, Kissling V, Guérois R, Seidel R, et al. Distinct RPA domains promote recruitment and the helicase-nuclease activities of Dna2. Nat Commun. 2021 Nov 11;12(1):1–15. [Link].
Balakrishnan, S. et al., 2024. Structure of RADX and mechanism for regulation of RAD51 nucleofilaments. Proceedings of the National Academy of Sciences, 121(12), p.e2316491121 [Link].
Bertosin, E. et al., 2021. Cryo-Electron Microscopy and Mass Analysis of Oligolysine-Coated DNA Nanostructures. ACS Nano, p. 15(6):9391–9403. [Link].
Camperi, J., et al. 2024. Comprehensive impurity profiling of mRNA: evaluating current technologies and advanced analytical techniques. Analytical Chemistry, 96(9), pp.3886-3897. [Link].
Cole, D. et al., 2017. Label-Free Single-Molecule Imaging with Numerical-Aperture-Shaped Interferometric Scattering Microscopy. ACS Photonics, p. 4(2): 211–216. [Link].
Cramer, D.A., Franc, V., Heidenreich, A.K., Hook, M., Adibzadeh, M., Reusch, D., Heck, A.J. and Haberger, M., 2023, December. Characterization of high-molecular weight by-products in the production of a trivalent bispecific 2+ 1 heterodimeric antibody. In MAbs (Vol. 15, No. 1, p. 2175312). Taylor & Francis. [Link].
Crowe, C. et al., 2024. Mechanism of degrader-targeted protein ubiquitinability. Science Advances, 10(41), p.eado6492. [Link].
den Boer, M.A. et al., 2021. Comparative analysis of antibodies and heavily glycosylated macromolecular immune complexes by size-exclusion chromatography multi-angle light scattering, native charge detection mass spectrometry, and mass photometry. Analytical Chemistry, 94(2), pp.892-900. [Link].
Dodge, G.J. et al., 2024. Mapping the architecture of the initiating phosphoglycosyl transferase from S. enterica O-antigen biosynthesis in a liponanoparticle. Elife, 12, p.RP91125. [Link].
Ebberink, E.H. et al., 2024. Probing recombinant AAV capsid integrity and genome release after thermal stress by mass photometry. Molecular Therapy Methods & Clinical Development, 32(3). [Link].
England, R. M. et al., 2020. Synthesis and Characterization of Dendrimer-Based Polysarcosine Star Polymers: Well-Defined, Versatile Platforms Designed for Drug-Delivery Applications. Biomacromolecules, p. 21(8):3332–3341. [Link].
Hickman, A. B. et al., 2020. Casposase structure and the mechanistic link between DNA transposition and spacer acquisition by CRISPR-Cas. eLife, p. 9:e50004. [Link].
Higuchi, Y. et al., 2021. Engineered ACE2 receptor therapy overcomes mutational escape of SARS-CoV-2. Nature Communications, p. 12:3802. [Link].
Li, Y., et al, 2020. Single-molecule mass photometry of nucleic acids. Nucleic Acids Research, p. e97. [Link].
Naftaly, A., et al, 2021. Revealing Advanced Glycation End Products Associated Structural Changes in Serum Albumin. ACS Biomaterials Science & Engineering, p. 7(7):3179–3189. [Link].
Nuber, F. et al., 2021. Biochemical consequences of two clinically relevant ND-gene mutations in Escherichia coli respiratory complex I. Scientific Reports volume, p. 11:12641. [Link].
Olerinyova, A. et al. 2021. Mass Photometry of Membrane Proteins. Chem 7, 224–236. [Link].
Schmudlach, A. et al. 2025. Mass photometry as a fast, facile characterization tool for direct measurement of mRNA length. Biology Methods and Protocols, 10(1), p.bpaf021. [Link].
Soltermann, F. et al., 2020. Quantifying Protein-Protein Interactions by Molecular Counting with Mass Photometry. Angewandte Chemie International Edition in English, pp. 59(27):10774-10779. [Link].
Vasquez, S. et al., 2023. Structural and biochemical investigations of a HEAT-repeat protein involved in the cytosolic iron-sulfur cluster assembly pathway. Communications Biology, 6(1), p.1276. [Link].
Wagner, C. et al., 2023. Quantification of empty, partially filled and full adeno-associated virus vectors using mass photometry. International Journal of Molecular Sciences, 24(13), p.11033. [Link].
Wagner, C. et al., 2024. Automated mass photometry of adeno-associated virus vectors from crude cell extracts. International Journal of Molecular Sciences, 25(2), p.838. [Link].
Wu, D. & Piszczek, G., 2020. Measuring the affinity of protein-protein interactions on a single-molecule. Analytical Biochemistry, p. 592:113575. [Link].
Wu, J. et al., 2025. Characterization of Lipid Nanoparticles Using Macro Mass Photometry: Insights into Size and Mass. Analytica Chimica Acta, p.343944. [Link].
Xu, J., Brown, N.J., Seol, Y. and Neuman, K.C., 2024. Heterogeneous distribution of kinesin–streptavidin complexes revealed by mass photometry. Soft matter, 20(28), pp.5509-5515. [Link].
Young, G. et al., 2018. Quantitative mass imaging of single biological macromolecules. Science, pp. 360(6387):423-427. [Link].
Author: Catie Lichten, PhD, Refeyn Scientific Communications Manager