This post was first published in November 2021
Updated on 15th August 2025
Mass photometry is a way to measure the mass of biomolecules and small viral capsids in solution without labels. It works by quantifying the interference between the light scattered by an individual molecule in contact with a measurement surface and the light reflected by that surface. The resulting signal – or ’contrast’ – is directly proportional to the molecule’s mass [1], [2] (read more about how mass photometry works).
The single-molecule nature of mass photometry makes it a powerful bioanalytical technique. It allows you to detect and quantify different populations of species in a sample. For example, it can be used to quantify protein oligomers (monomers, dimers, trimers, etc.) (see Fig. 2 below), to characterize protein-protein interactions and calculate binding affinities, and to quantify populations of empty, partially filled and full adeno-associated virus (AAV) capsids.
Mass photometers report the data they obtain – profiles of the mass distribution of the components of a sample – as histograms. Knowing how to interpret a mass histogram is essential for making sense of mass photometry. Here, we explain how mass histograms are generated, and how to read and understand them.
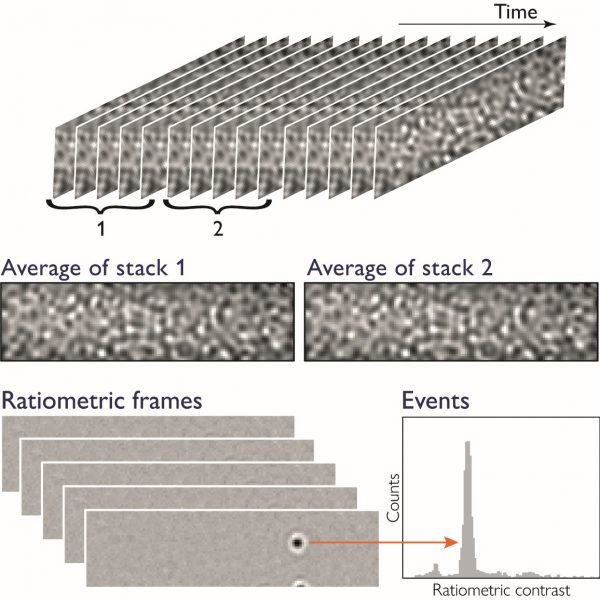
Mass photometry data is simply a series of images (Fig. 1). For each image in the series, the average of N frames is taken and divided by the average of the N subsequent frames to reveal how much the signal changed when a particle landed on the glass surface. When molecules and other small particles land on the glass surface, they produce signals in these ratiometric frames that are detected and counted. These signals are reported in the mass histogram.

Figure 1 Generation of the mass photometry signal. Images of the glass surface, taken over time, are divided into two stacks of N consecutive frames (typically N=5). These stacks are averaged to calculate a single ratiometric frame. The process is repeated for stacks of frames shifted by one frame at a time, generating a ratiometric movie that shows when particles land on the glass surface as well as their contrast signal.
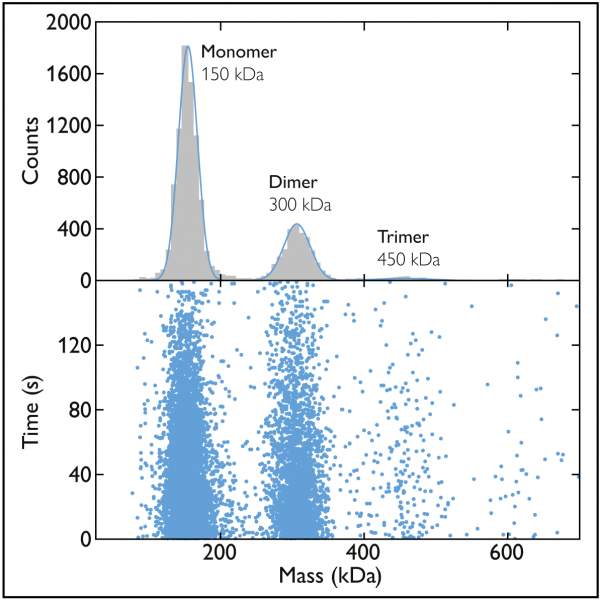
The typical mass photometry measurement lasts for one minute, and hundreds to thousands of landing events can be detected by the mass photometer during that time. Histograms are a helpful way to visualize those many single-molecule measurements (Fig. 2).

Figure 2 Mass photometry data of a sample of the antibody 2G12. The scatter plot (bottom) shows the mass measurements associated with the many landing events recorded over a 160-second time period. The mass photometry histogram (top) presents the data as a histogram, with the peaks fit by Gaussian curves. In this example, the peaks correspond to monomers, dimers and trimers of 2G12 IgG, a monoclonal antibody against the HIV envelope glycoprotein gp120.
In histograms, the measurements of single-particle landing events are grouped into narrow mass ranges (‘bin’) to make the data easier to interpret. Each bin is represented by a vertical bar, and the height of the bar (the ‘counts’) tells you how many measurements fell into that particular range. If a bar is tall, it means that the mass photometer counted many landing events within that mass range.
As for most biological data, repeated measurements of molecules with the same mass will produce data with some variability that is centered on the true value. In a mass photometry histogram, such data will appear as peaks made up of several bars. Each peak can be fit by a Gaussian curve (Fig. 2) – a straightforward statistical approach that is implemented in DiscoverMP, the custom-built data analysis software that works with Refeyn’s mass photometry instruments.
This fitting yields two key values: The mean of the peak and its standard deviation. The mean is the mean mass of the particles whose data formed the peak, while the standard deviation indicates how spread out the values are – an indicator of the uncertainty in the measurement.
Often, a mass photometry histogram will have multiple peaks, indicating that there are multiple species present in the sample. Indeed, the single-molecule nature of mass photometry means that you can characterize samples containing many different species across a broad mass range. The different species can be detected provided they differ enough in mass (the mass differences must be above the resolution of the instrument – learn more about mass photometry resolution).
As an example consider a sample containing the antibody 2G12, which is known to form oligomers. In the histogram, we can see three peaks, indicating that there were three protein species, each with different mass, in the sample (Fig. 2). From the mean of each peak (which tells us the mass of the molecules in that subpopulation), we can conclude that the peaks correspond to 2G12 monomers, dimers and trimers.
We can also use the mass histogram information to assess the relative abundance of the different species detected. Already, from just a quick glance at the sizes of the peaks, we can see that the monomers were the most abundant, followed by dimers and then trimers. But going beyond that quick glance, by looking at the number of counts that contributed to each peak, we can quantify those abundances.
You can even use the information on the relative abundances to determine proteins’ binding affinities [3].
There are numerous examples in the literature of mass photometry being used for protein characterization, including in research into hemoglobin scavenging [4], R2TP chaperones [5], antifungal drug targets [6] and many other areas. It is also increasingly used to study other types of biomolecules like nucleic acids [7] and AAVs [8].
Mass photometry gives a detailed overview of the contents of a sample while requiring little time investment and sample consumption. These strengths make it especially useful in the context of pharmaceutical development, where critical quality attributes of samples need to be frequently characterized. Here we show an example – extracted from a larger collaboration with Absolute Antibody – of what information a mass photometry histogram can provide.
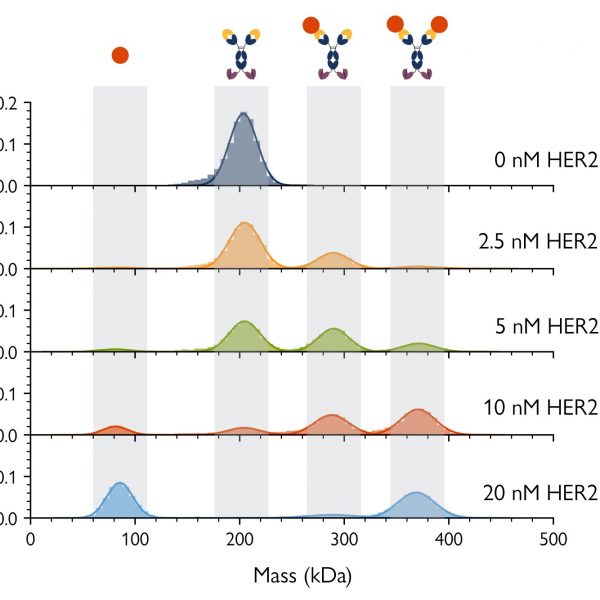
Fig. 3 shows mass photometry analyses of samples of a bispecific antibody mixed with the HER2 antigen – one of its targets – at five different concentrations. At each concentration, the mass photometry histograms showed each of the isolated components of the sample (the antibody and antigen), as well as antibody-antigen complexes with different stoichiometries. As mass photometry also quantifies the relative proportions of each species, it is possible to calculate the binding affinities of the different complexes present in the sample, even in cases where multiple interactions are present.

Figure 3 Mass photometry resolves complex bsAb-antigen interactions. The concentration of bsAb-A was kept constant at 5 nM, while the HER2 concentration was varied (0.0, 2.5, 5.0, 10 and 20 nM). Mass photometry histograms (measured at equilibrium) show peaks and corresponding counts for each individual species as well as 1:1 HER2-bsAb complexes and 2:1 HER2-bsAb complexes. As the HER2 concentration increases, the peaks corresponding to free antigen and the 2:1 complex become more prominent, indicating that populations of those species are increasing.
If you would like to learn more about mass photometry, we recommend the following resources:
Webinar: Quantifying protein-protein interactions by molecular counting with mass photometry
Fabian Soltermann from the University of Oxford talks about his work on mass photometry and the quantification of protein-protein interactions in antibody-antigen systems. Fabian shows how we go from counting single molecules with mass photometry to obtaining information on the purity of samples, as well as on stoichiometry, affinity and binding kinetics.
Refeyn’s TwoMP mass photometer is optimized for characterizing proteins and nucleic acids, as well as their interactions. With its high sensitivity, the TwoMP is ideally suited for measurements at physiological (i.e. low) concentrations, with measurements at higher concentrations enabled by the MassFluidix HC add-on. The high dynamic range intrinsic to single molecule counting techniques ensures low-abundance species are still captured accurately.
[1] G. Young et al., ‘Quantitative mass imaging of single biological macromolecules’, Science, vol. 360, no. 6387, pp. 423–427, Apr. 2018, doi: 10.1126/science.aar5839.
[2] G. Young and P. Kukura, ‘Interferometric Scattering Microscopy’, Annu. Rev. Phys. Chem., vol. 70, no. 1, pp. 301–322, Jun. 2019, doi: 10.1146/annurev-physchem-050317-021247.
[3] F. Soltermann et al., ‘Quantifying Protein–Protein Interactions by Molecular Counting with Mass Photometry’, Angew. Chem. Int. Ed., vol. 59, no. 27, pp. 10774–10779, 2020, doi: 10.1002/anie.202001578.
[4] S. Tamara, V. Franc, and A. J. R. Heck, ‘A wealth of genotype-specific proteoforms fine-tunes hemoglobin scavenging by haptoglobin’, Proc. Natl. Acad. Sci., vol. 117, no. 27, pp. 15554–15564, Jul. 2020, doi: 10.1073/pnas.2002483117.
[5] T. V. Seraphim et al., ‘Assembly principles of the human R2TP chaperone complex reveal the presence of R2T and R2P complexes’, Structure, vol. 0, no. 0, Sep. 2021, doi: 10.1016/j.str.2021.08.002.
[6] S. M. H. Chua et al., ‘Structural features of Cryptococcus neoformans bifunctional GAR/AIR synthetase may present novel antifungal drug targets’, J. Biol. Chem., p. 101091, Aug. 2021, doi: 10.1016/j.jbc.2021.101091.
[7] Schmudlach A, et al., ‘Mass photometry as a fast, facile characterization tool for direct measurement of mRNA length’, Biology Methods and Protocols, Biol. Methods Protoc., 2025;10(1):bpaf021, doi:10.1093/biomethods/bpaf021
[8] C. Wagner et al., ‘Quantification of empty, partially filled and full adeno-associated virus vectors using mass photometry’, Int. J. Mol. Sci., 3;24(13):11033, Jul. 2023, doi: 10.3390/ijms241311033.