Technology Comparison: Mass Photometry vs. Size-Exclusion Chromatography (SEC)
Technical comparison: Mass photometry vs. SEC
Both mass photometry and size-exclusion chromatography (SEC) offer label-free analysis of biomolecules in solution (Fig. 1). While they can be used for many of the same applications, they work differently and have different capabilities, strengths and limitations.
Understanding these differences – from sample and time requirements to experimental design needs, resolution and the information that can be obtained – is important for deciding which technique is right for your needs.
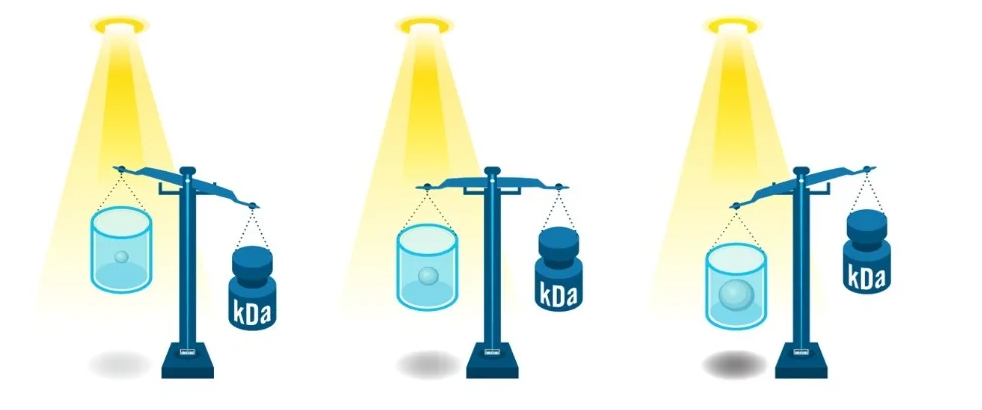
Mass photometry measures the mass of individual biomolecules in solution rapidly by analyzing the light they scatter when in contact with a glass substrate. The resulting signal – based on interferometric light scattering and called the mass photometry ‘contrast’ – is directly proportional to mass. (Read our article, How does mass photometry work?, to learn more).
Mass photometry can measure particles including proteins, nucleic acids and AAVs. It can, for example, analyze protein-protein interactions and oligomerization, antibody aggregation and antibody-antigen binding, mRNA size and integrity, sample purity, and AAV empty/full ratios. Introduced in 2018, mass photometry is a relatively new technique.
Size-exclusion chromatography (SEC) separates molecules based on size (hydrodynamic volume), using a column filled with porous polymer beads. After separation, the eluted fractions are analyzed, often using either UV absorbance (SEC-UV) – to measure the concentration of proteins or nucleic acids – or multi-angle light scattering (SEC-MALS) – to measure the molecular weight and size of particles in each fraction.
Also known as gel filtration chromatography, SEC has been in use for decades. It can measure a wide range of particles – from peptides to vectors and nanoparticles. Its analytical applications include the assessment of protein oligomerization and complex formation, sample purity, and stability and aggregation.
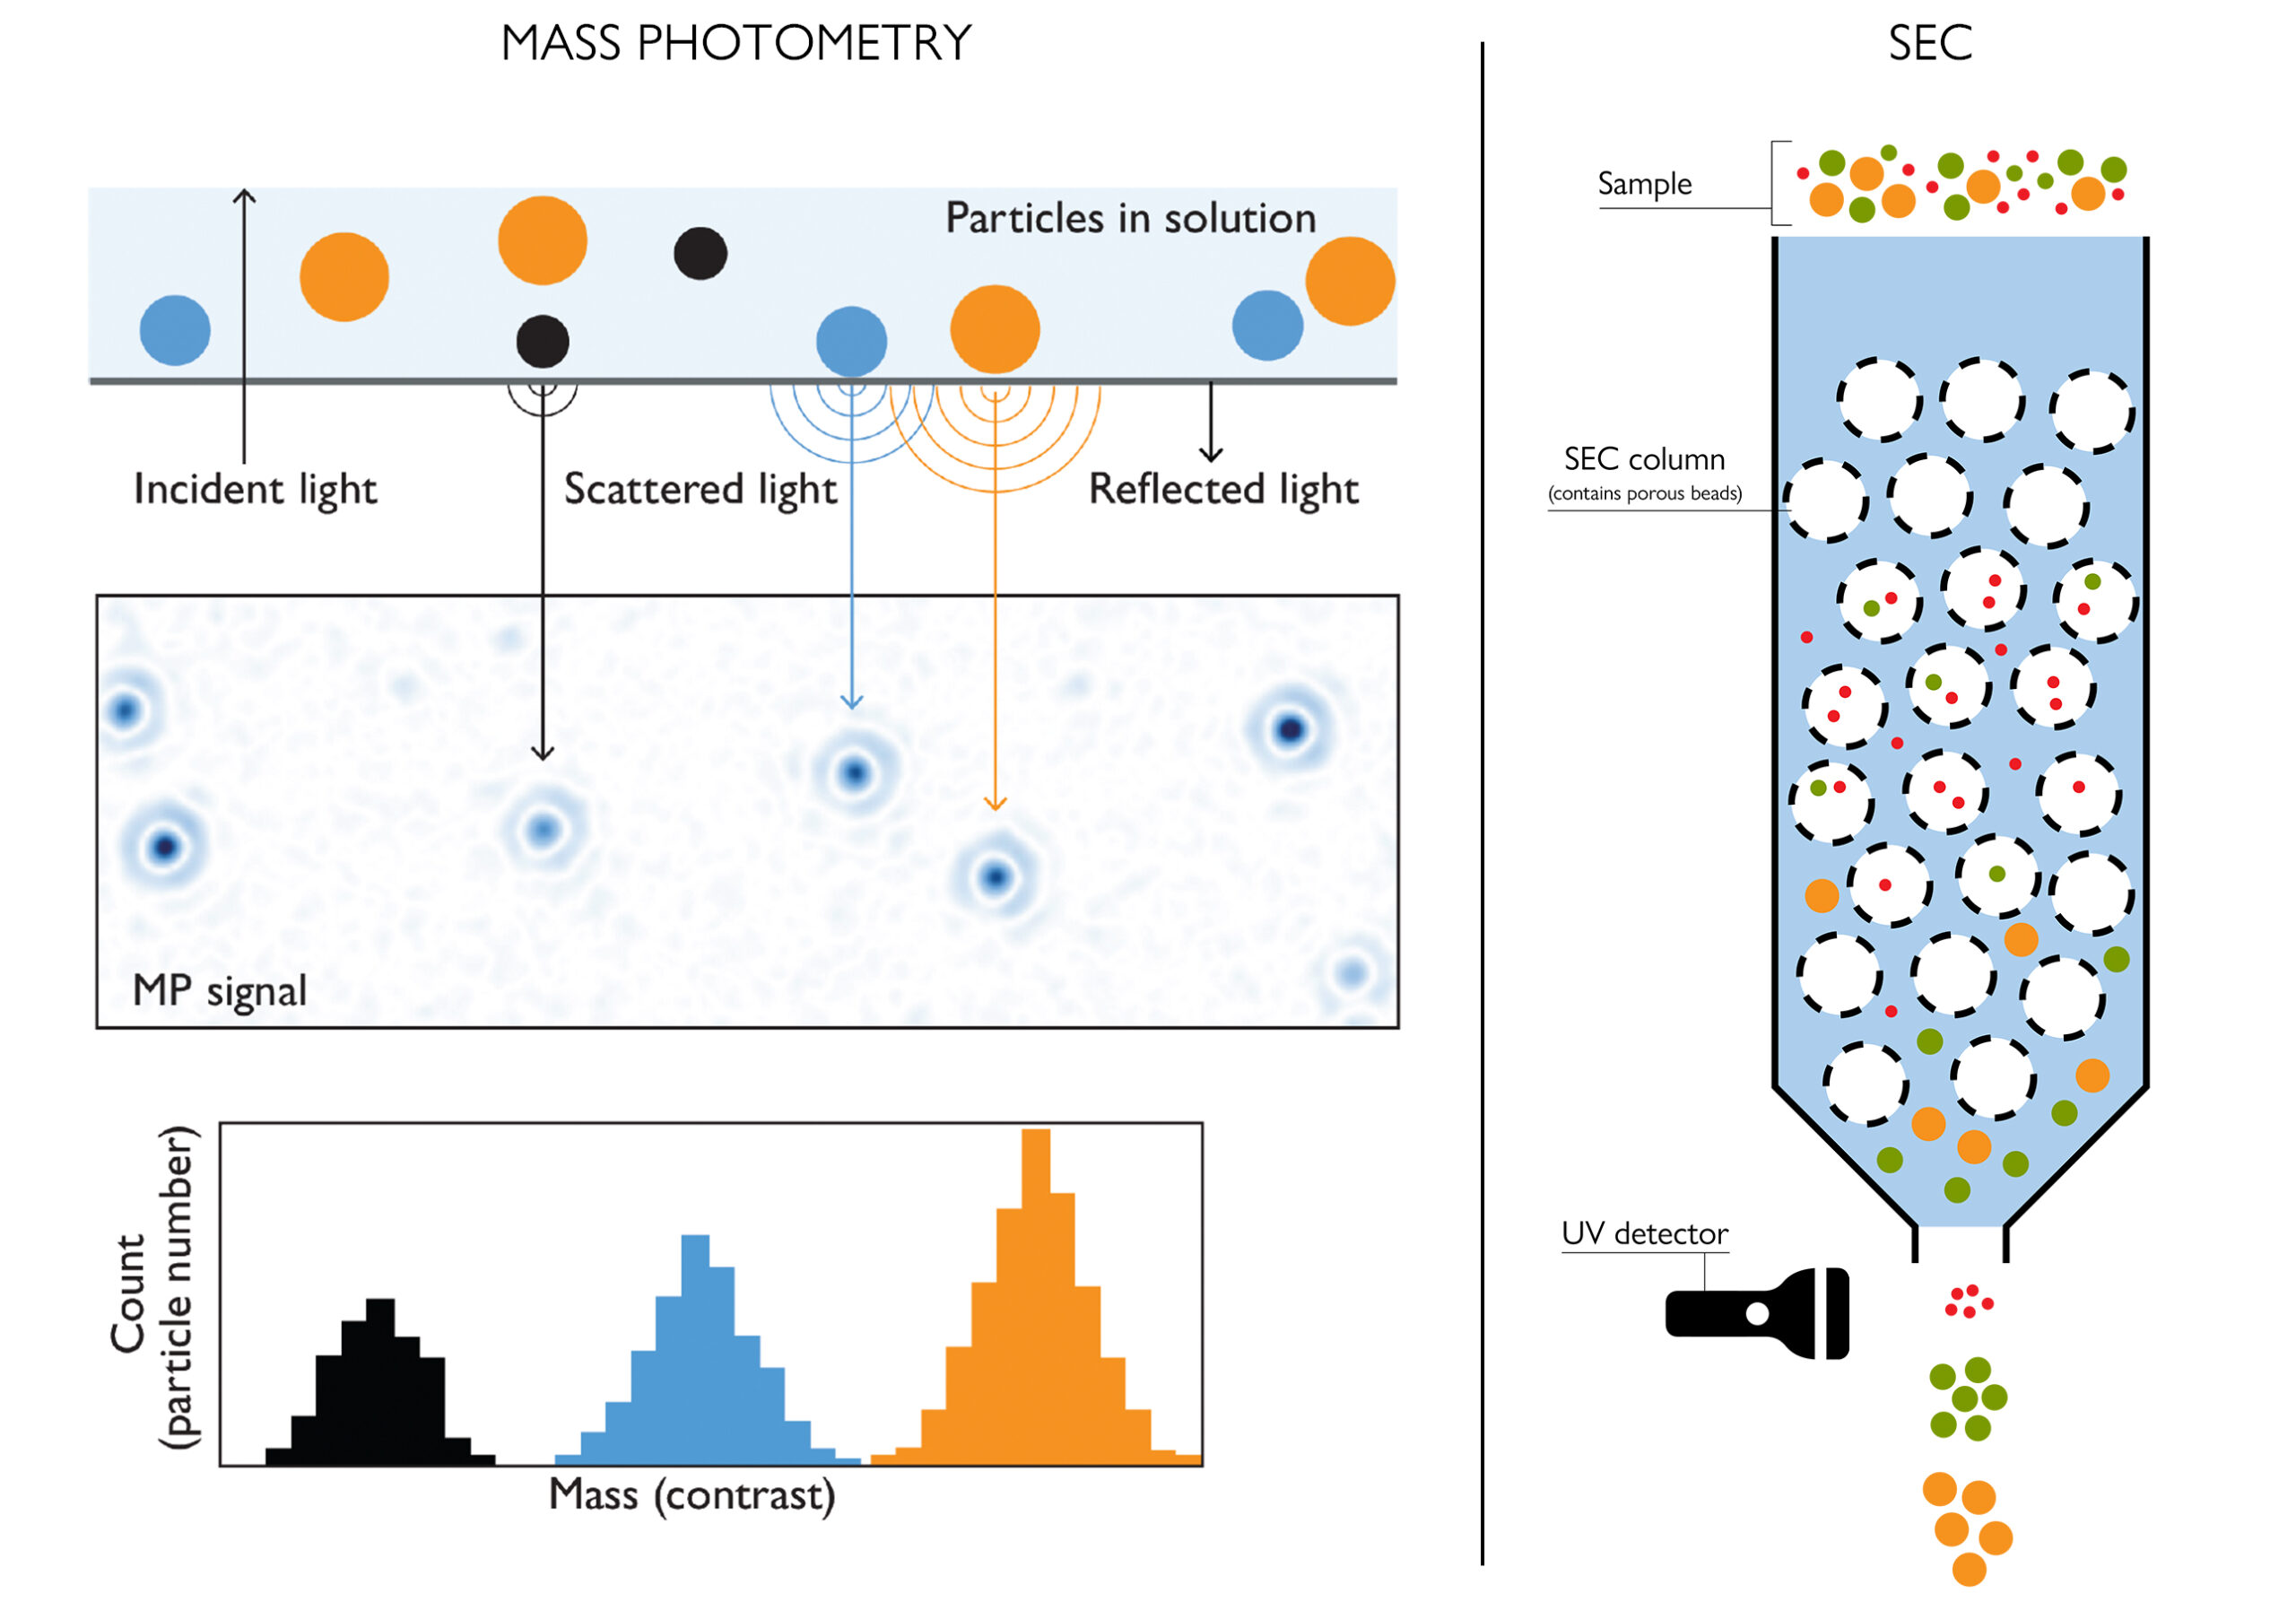
Figure 1. Mass photometry vs. SEC: Two approaches to molecular characterization. Mass photometry measures the mass of single molecules in solution by analyzing the light they scatter. In SEC, a column first separates molecules based on size, then the resulting fractions are analyzed, often using UV absorbance, as shown here.
Summary of differences
An overview of the key differences between mass photometry and SEC:
| Mass photometry | SEC-UV/SEC-MALS | |||||
|---|---|---|---|---|---|---|
|
Principle |
Measures individual molecules landing on a surface by detecting interferometric light scattering, which is proportional to their mass. |
Separates molecules based on size (hydrodynamic volume) as they pass through a porous resin, then measures UV absorbance or MALS. |
||||
|
Output |
Mass distribution histogram |
SEC-UV: UV absorbance (~concentration) vs. elution time (~hydrodynamic radius) SEC-MALS: Mass-weighted average molar mass vs. elution time (~hydrodynamic radius) |
||||
|
Molecular resolution |
Single molecule |
Ensemble average for each elution peak |
|
|||
|
Label-free |
Yes |
Yes |
|
|||
|
Measurement in native buffer |
Yes |
Yes |
|
|||
|
Sample consumption |
10–20 µL at nM concentration (~30 ng)
|
5–100 µL at µM concentration (but depends heavily on the column and desired resolution) |
|
|||
|
Sample concentration |
Nanomolar (or micromolar if MassFluidix microfluidic system is used) |
Micromolar |
||||
|
Analysis time |
1 min |
20–25 min |
|
|||
|
Measurement resolution |
Depends on mass, e.g. 25 kDa FWHM at 66 kDa |
Depends on column, but generally inferior to mass photometry
|
||||
|
Particle mass range |
30 kDa – 5 MDa |
Depends on column, but can be ~ 10 kDa to multiple MDa |
||||
|
|
||||||
|
Preparation steps |
Simple dilution; a wide range of buffers can be used |
Column and buffer optimization may be required |
||||
|
Separation of different fractions |
No |
Yes |
||||
|
Walkaway time |
Automated instruments (TwoMP Auto and SamuxMP Auto) can run ~24 samples unattended, providing 90+ min walkaway time per batch; ideal for medium-throughput analysis |
Autosamplers allow long unattended runs (dozens–hundreds of samples over hours to days), depending on column, flow rate, and fraction collection; ideal for high-throughput or preparative applications |
||||
Mass photometry vs. SEC: Quick overview
Compared to SEC, mass photometry is faster, avoids column interaction issues, and uses less sample, as explained by Refeyn Market Development Manager Salma Jalal, PhD.
Key differences between mass photometry and SEC
Speed
Mass photometry measurements take 1 minute, while SEC takes 20–25 minutes.
Information reported
While SEC methods characterize species through their elution profiles and concentration-dependent detector signals, mass photometry provides both the direct molecular mass and the particle-by-particle counts of each species.
Mass photometry produces a mass distribution histogram – a plot showing the number of individual landing events (abundance) vs. mass. Each peak in this distribution corresponds to a population of molecules (or particles) with a specific molecular weight.
SEC-UV reports the concentrations of species (provided molar extinction coefficients of each species are known) as a function of elution time, which reflects their hydrodynamic size. It does not directly provide information about mass.
Mass photometry and SEC-UV data cannot be directly compared without accounting for differences in the molar extinction coefficients of different species (Fig. 1). To learn more about mass photometry vs. SEC-UV, see our tech note, Mass photometry vs SEC in protein analysis.
SEC-MALS reports the molar mass vs. elution time. If multiple species co-elute, the reported molar mass is a mass-weighted average of those species.
Sample consumption
Although SEC requirements can vary, it generally uses more than 100x more sample than mass photometry. Both require similarly low sample volumes (as little as 5 µL for SEC and 10–20 µL for mass photometry), but SEC requires a much higher concentration (micromolar) while mass photometry samples should be in the tens of nanomolar. This means that SEC uses more than 100x more sample than mass photometry.
Mass photometry’s low sample consumption is beneficial when working with precious samples, but it can be a drawback for analyzing low-affinity interactions or aggregation, which can ‘fall apart’ in more dilute conditions. Measurements of more concentrated samples with mass photometry are possible with a microfluidics add-on (MassFluidix™ HC).
Range
The range of particles that can be analyzed is broader for SEC than for mass photometry. Depending on the column used, SEC can analyze peptides with molecular weight (MW) as low as 0.1 kDa, while the minimum MW detectable with mass photometry is 30 kDa. The upper bound for standard mass photometry is 6 MDa, and macro mass photometry can be used to characterize particles with diameter up to 150 nm. With the appropriate SEC column, particles of diameter up to 300 nm can be analyzed.
Method optimization
For SEC, column and buffer selection can be challenging because interactions can occur between the sample and the column matrix. Proteins may stick to the column, aggregate, or dissociate if buffer conditions (pH, ionic strength, additives) and chromatography conditions (pore size, material, column length) are not carefully optimized. Finding a suitable combination often requires repeated trial and error, which can also be costly. For mass photometry, there is no separation step and the method is compatible with a broad range of buffers, so lengthy optimization is not required.
Resolution
Overall, mass photometry is better able to resolve (distinguish) distinct species than SEC. However, when comparing them, it is important to keep in mind that mass photometry distinguishes molecules directly based on mass, while SEC separates them based on hydrodynamic radius. Mass photometry reports the mass distribution of all the molecules (or particles) in a sample within its detection range with single-molecule resolution. SEC provides averaged (bulk) values, as it reports an average for each elution peak. As a result, mass photometry is better able to detect low-abundance populations and resolve distinct populations in heterogeneous samples.
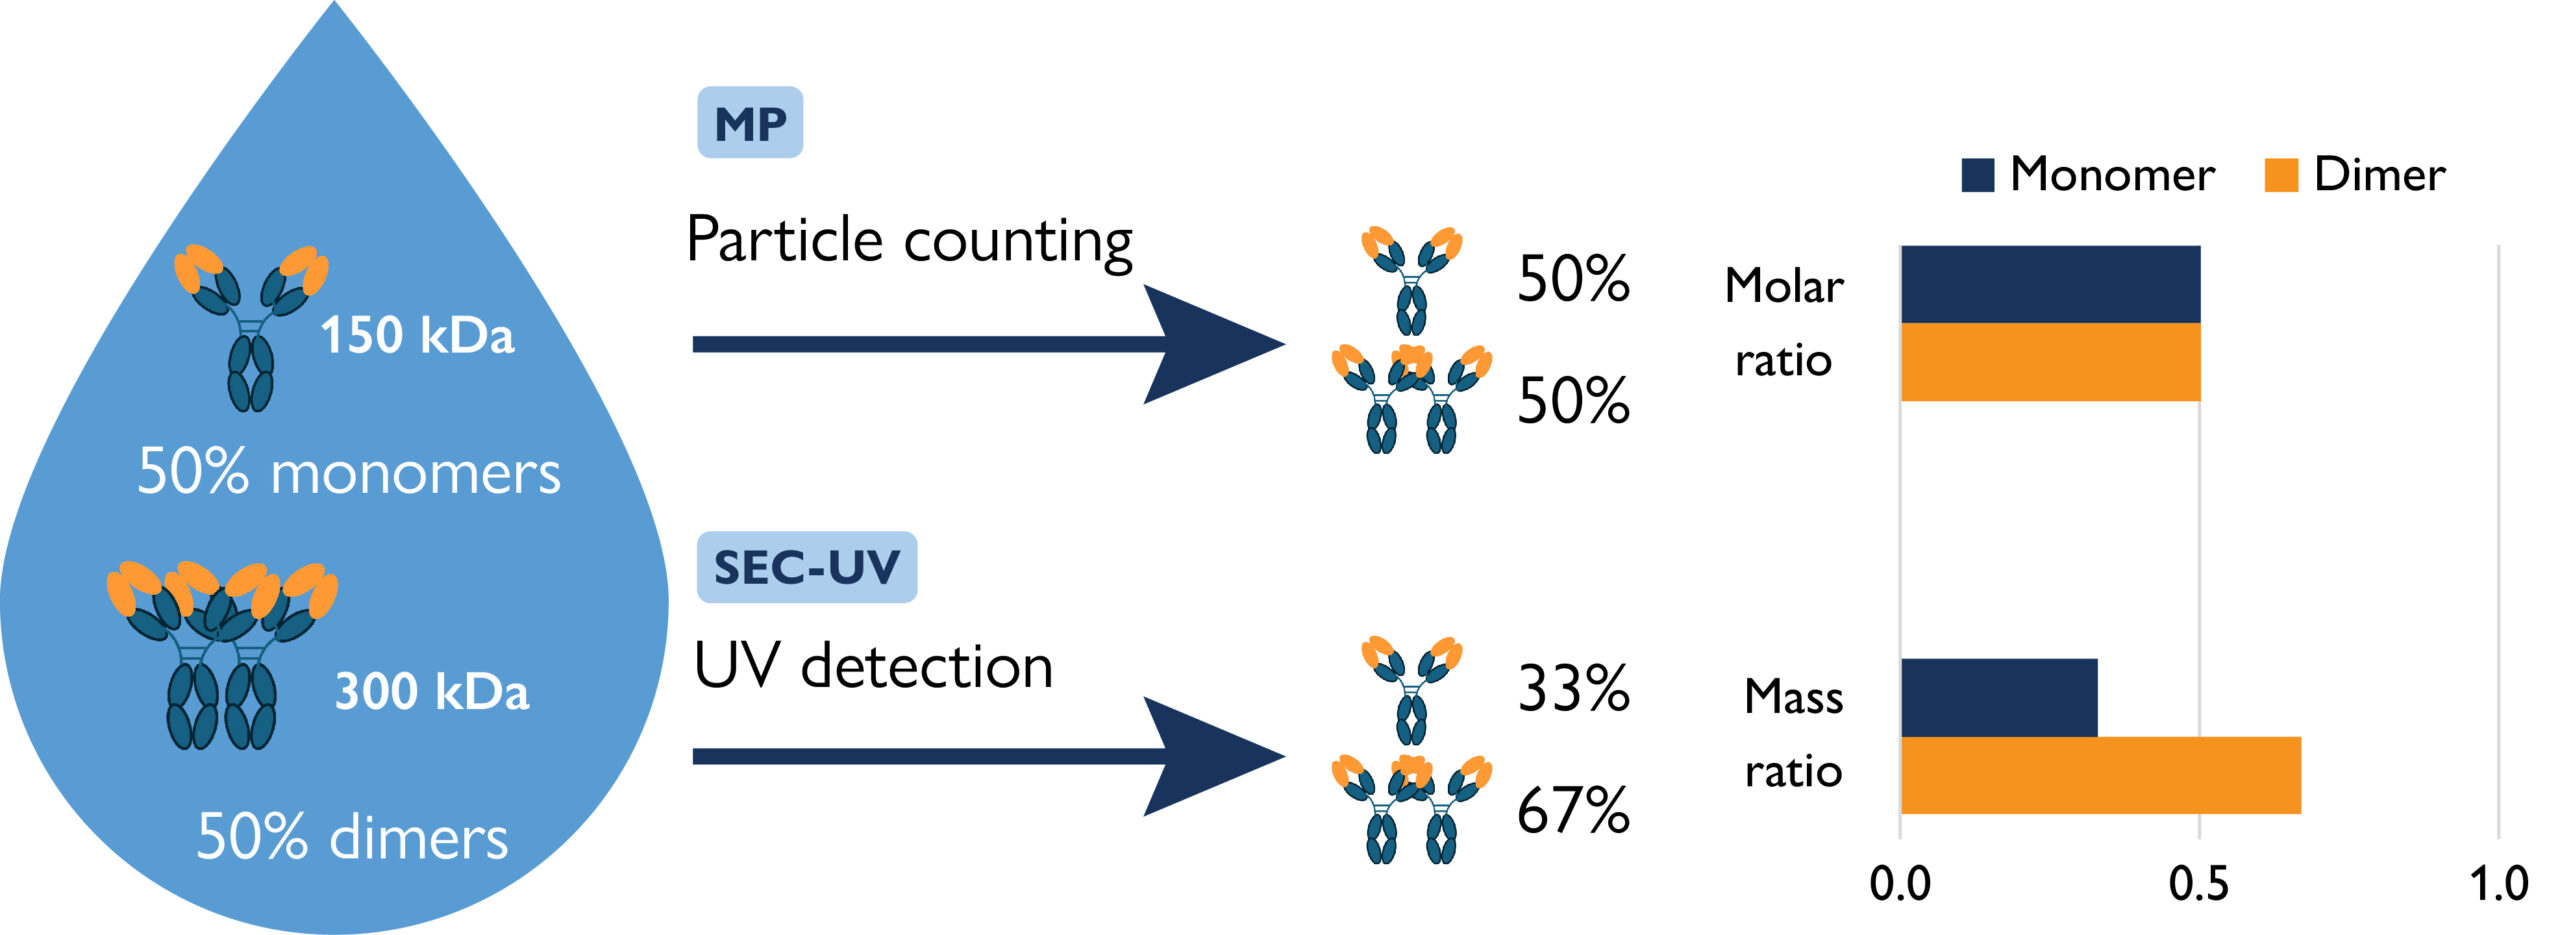
Figure 2. Mass photometry (MP) reports the molar ratio while SEC-UV reports the mass ratio. In this example, MP would report equal amounts of dimers and monomers if both were present in equal amounts. But in SEC-UV, dimers would produce twice the signal as monomers, due to having double the mass (and absorbance).
Case studies
Antibody aggregation studies
Monoclonal antibodies are an important class of biotherapeutics, and are known to aggregate into dimers, trimers and higher-order structures. This can occur during expression, downstream processing or storage, and impacts therapeutic efficacy and safety. Antibody aggregation is therefore a critical quality attribute (CQA) and SEC is the standard analytical method used to assess it.
SEC is widely used to measure aggregation because it can separate and detect aggregates as well as fragments, and preserves the sample and native behavior. However, a significant drawback of this approach is unforeseen interactions with the chromatographic columns. For this reason, it is important to apply a column-free orthogonal method to confirm SEC results.
While mass photometry does not separate different fractions, it does quantify monomers, dimers, trimers, and higher-order aggregates in the native buffer. Both SEC and mass photometry also enable direct visualization of the results.
Mass photometry measurements are also typically performed at much lower concentrations than SEC, which can complicate direct benchmarking against SEC data acquired at micromolar levels (mass photometry measurements can be run at higher concentrations with a microfluidics add-on). However, this low-concentration capability can be advantageous for studying dilute formulations, such as those used in in-use studies for therapeutics administered by IV bags, where concentrations match those used in MP.
Mass photometry may also provide a more complete picture of sample integrity, while eliminating the ambiguities that may arise from SEC column interactions. In a comparative study, mass photometry made it possible to identify and quantify higher-order antibody oligomers that were not resolved with SEC analysis (Fig. 3), and it provided clear and consistent data when column retention affected SEC results.
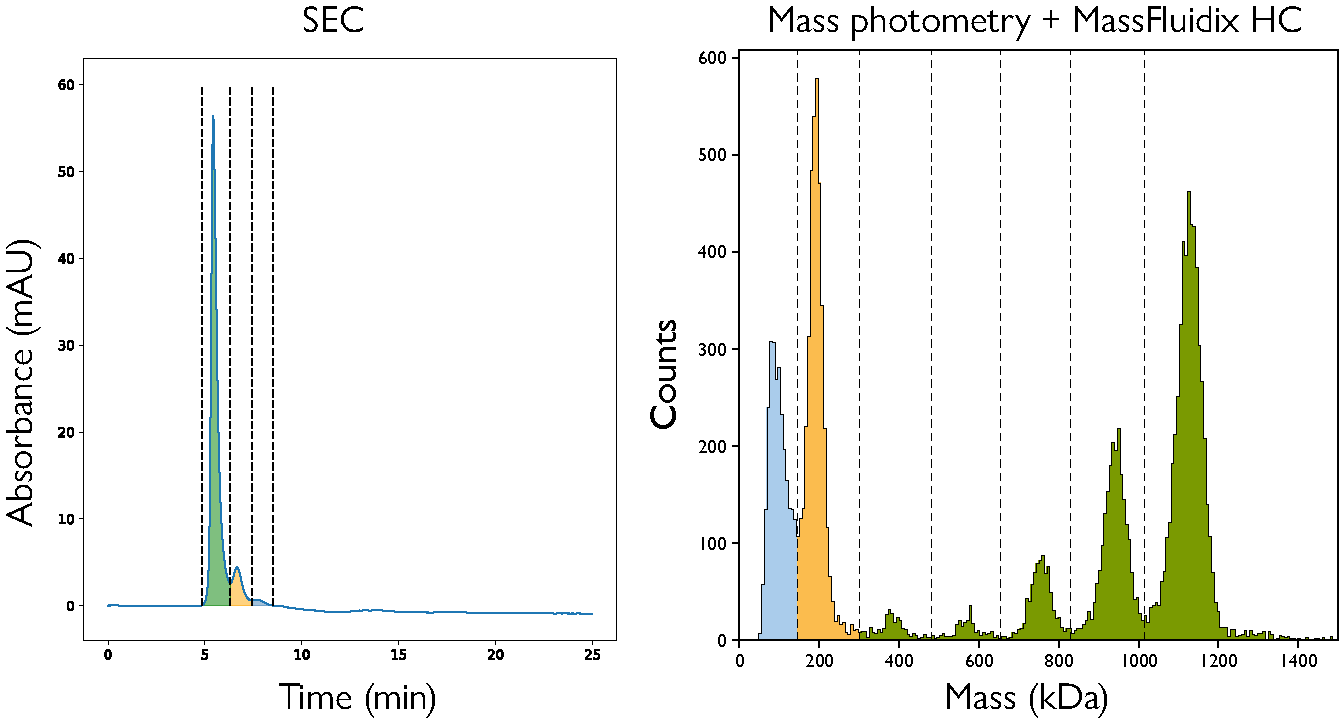
Figure 3. IgM pentamers and hexamers were only resolved by mass photometry. Analysis of an IgM antibody with SEC (left) and mass photometry with MassFluidix (right) indicate that the major eluting peak from the SEC trace is associated with at least three species: Tetramers, pentamers and hexamers. The colored peak regions correspond to monomers (blue), dimers (light orange) and higher-order species (green).
Protein-protein interactions and oligomerization
Understanding protein interactions, including antibody-antigen interactions, under physiologically relevant conditions is crucial for drug discovery and development. Both mass photometry and SEC can be used to measure protein interactions. SEC separates complexes based on hydrodynamic size, allowing detection and separation of monomers and oligomers, and SEC-MALS adds the ability to measure molar mass, giving stoichiometry information. SEC requires relatively high sample concentrations (typically micromolar), but weak interactions can be disrupted by column interactions or the separation process.
Mass photometry can also detect and quantify monomers, oligomers, and other complexes. It operates in native buffer conditions and at equilibrium, with no risk of dissociation during separation. While standard mass photometry requires dilute samples, use of a microfluidics add-on enables binding studies across a broad concentration range (nanomolar to the tens of micromolar). It therefore covers the range where many therapeutic antibodies operate in vivo as well as enabling the measurement of low-affinity interactions, which require higher concentrations.
While SEC provides separation and purification as well as characterization, mass photometry offers fast, low-volume, single-molecule quantification – making the two methods complementary.
Learn more about resolving protein-protein interactions with mass photometry
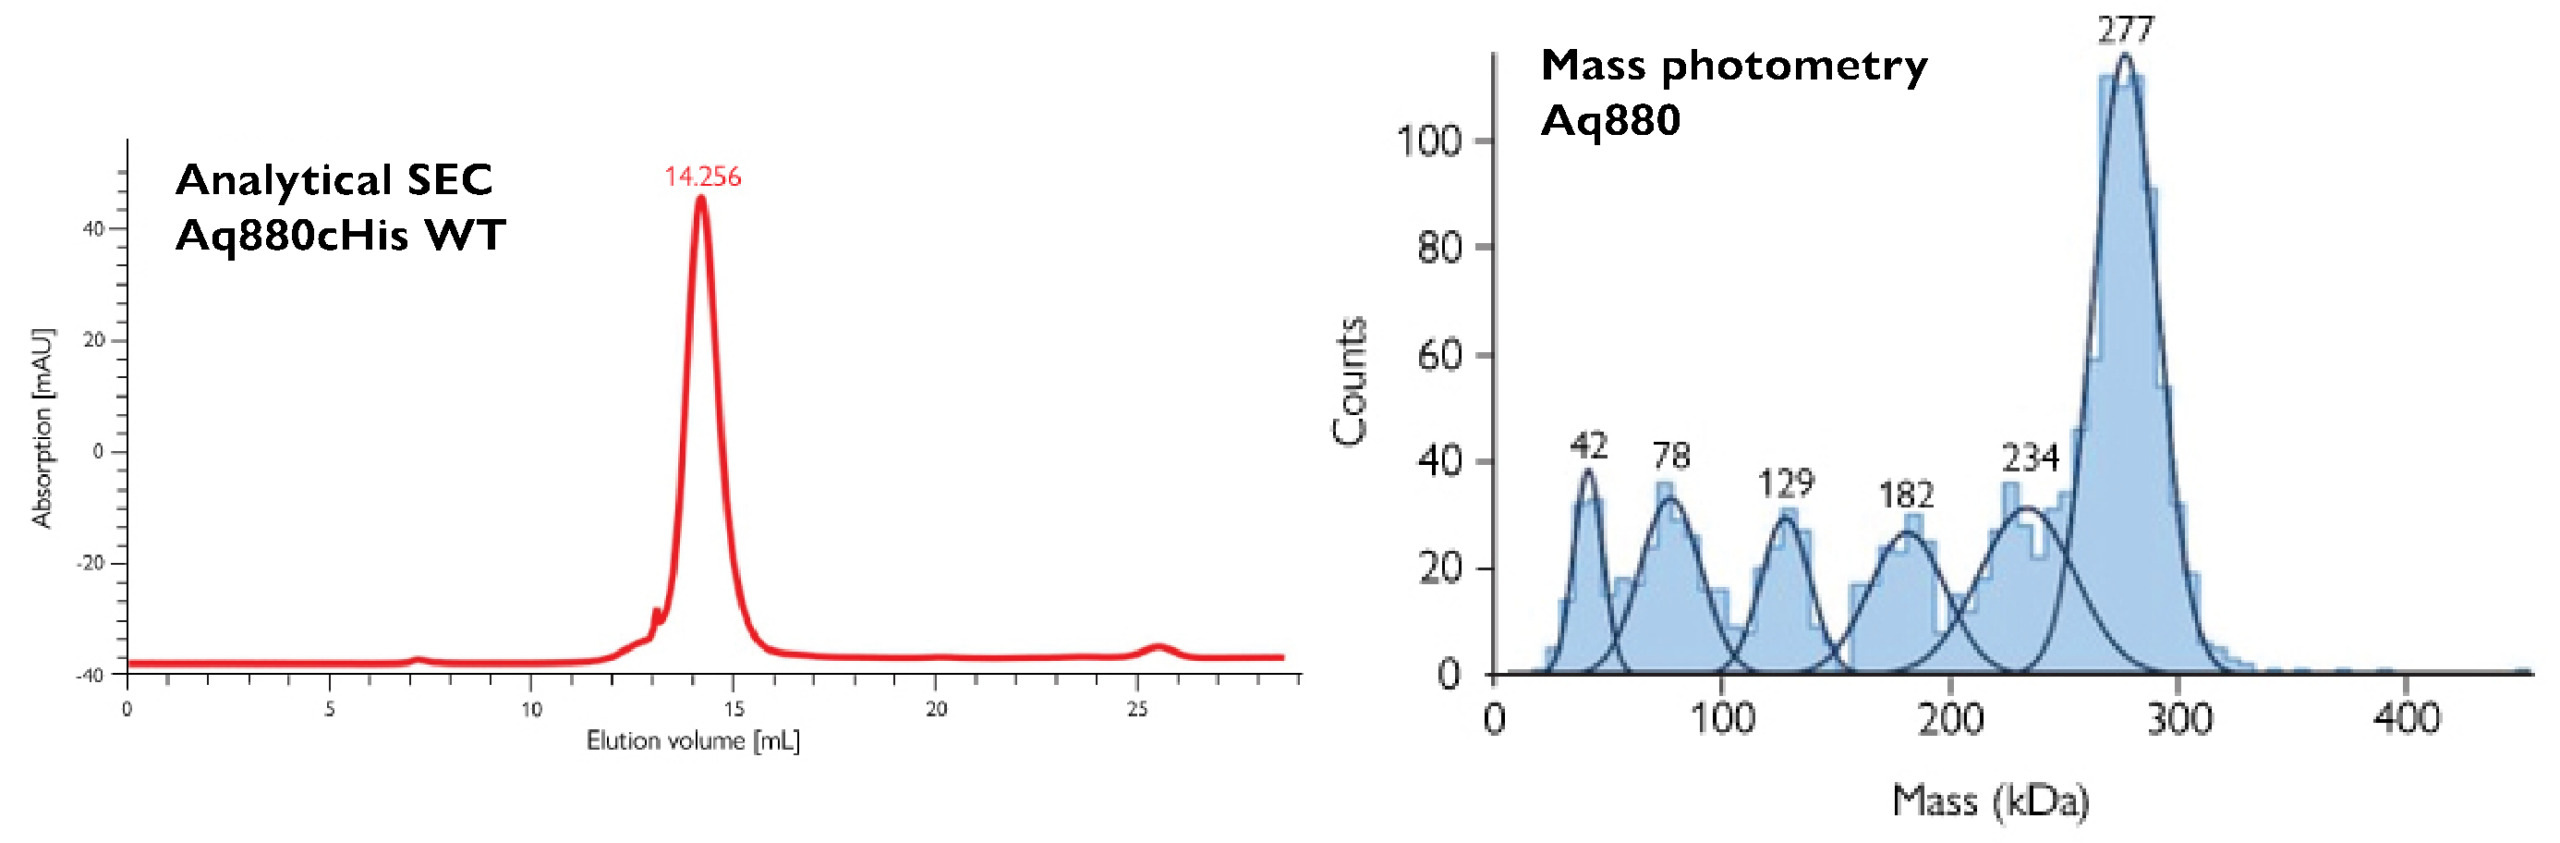
Figure 4. Mass photometry (MP) reveals polydispersity. MP analysis of A. aeolicus RNase P (Aq880) revealed a major species at 277 kDa, along with several lower-mass species – a crucial insight for Feyh et al., eLife 2021. The authors reported: “Polydispersity of Aq880, not detectable in SEC profiles, is probably the reason why all structural approaches failed so far.”
Figure 5. Quantifying empty, full and partially filled AAVs with mass photometry and SEC-MALS. Populations of empty and full AAV vectors form clearly visible peaks and represent the bulk of the sample, while partially filled capsids are distributed across an intermediate mass range. The mass photometry measurement was consistent with a SEC-MALS measurement of the same sample, although SEC-MALS cannot resolve partially filled capsids.
AAV vector analytics
As AAVs are increasingly used as a vector to deliver gene therapies, the need for effective and efficient methods that assess their composition and quality has become more pressing. One crucial CQA for AAV manufacturing and process development is capsid content – the proportions of empty, partially filled or full capsids. Two methods that can be used to assess the percentages of empty and full capsids are mass photometry and SEC-MALS.
While SEC cannot differentiate empty vs. full capsids due to their hydrodynamic sizes being the same, MALS can be used to calculate the amounts of protein and nucleic acid in each elution fraction. It is from this light scattering measurement, and assuming all capsids are either empty or full, the proportion of full capsids can be determined.
Mass photometry, on the other hand, can resolve partially filled and overfull capsids, as well as empty and full (Fig. 5). It can also be applied further upstream than typical AAV vector analytics, including SEC-MALS. It can be applied to clarified harvests with a quick purification protocol, enabling earlier performance assessment based on true purity profiles and helping to eliminate costly re-work in downstream phases of the process.
Publications comparing SEC and MP
Pre-Clinical In-Vitro Studies on Parameters Governing Immune Complex Formation
"SEC and SV-AUC without signal amplification procedures… does not allow for the analysis of protein complexes at low nanomolar concentrations… mass photometry (MP), was employed to gain insight into relevant aspects of immune complex formation at physiological concentrations."
Comparative Analysis of Antibodies and Heavily Glycosylated Macromolecular Immune Complexes by Size-Exclusion Chromatography Multi-Angle Light Scattering, Native Charge Detection Mass Spectrometry, and Mass Photometry
"MP measurements... could be performed down to nM range concentrations that cannot be assessed by native MS or SEC."
Structure and mechanistic features of the prokaryotic minimal RNase P
“Polydispersity of Aq880, not detectable in SEC profiles, is probably the reason why all structural approaches failed so far.”
Explore resources comparing mass photometry and SEC
Mass photometry a column-free orthogonal to SEC-UV
In this technical note, we explore datasets captured through mass photometry and size exclusion chromatography (SEC), comparing how they characterize the aggregation levels in different biosimilar antibodies. Mass photometry gave comparable results to SEC but used 300x less sample and was 24x faster.
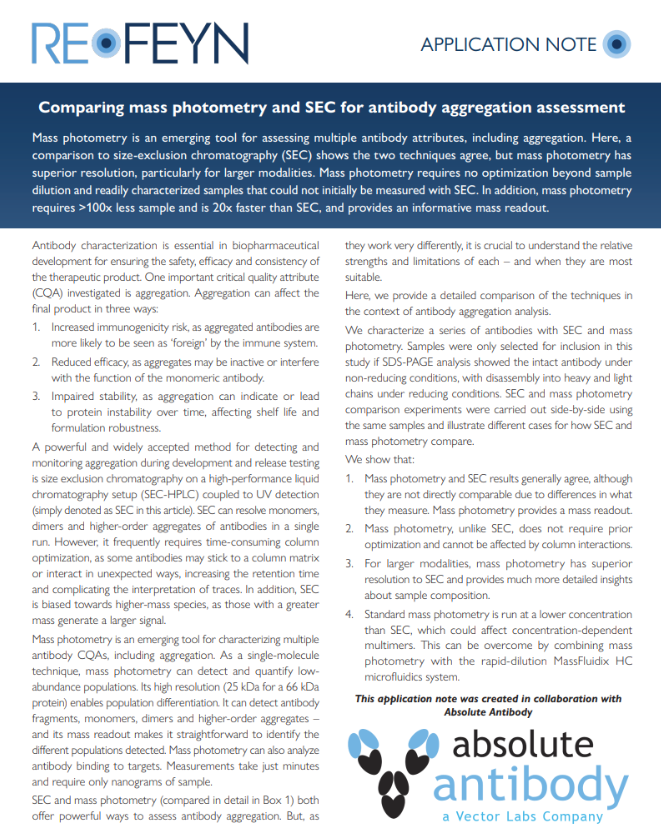
Comparing mass photometry and SEC for antibody aggregation assessment
Mass photometry is an emerging tool for assessing multiple antibody attributes, including aggregation. In this app note, a comparison to size-exclusion chromatography (SEC) shows the two techniques agree, but mass photometry has superior resolution, particularly for larger modalities.
How to derisk and accelerate antibody development: Column-free analysis with mass photometry
This webinar compares mass photometry with SEC-HPLC for assessing antibody purity and aggregation across different formats, showing that when SEC-HPLC provides meaningful results, mass photometry agrees while offering superior single-particle resolution of oligomeric states.
How does mass photometry work?
Mass photometry is a bioanalytical technology that measures the mass of individual biomolecules or particles in solution by quantifying light scattering.
Overcome analytical bottlenecks with mass photometry
Dr. Martin E. and Dr. Marie A. are experienced scientists – characterizing antibody and gene therapy samples at one of the top 5 pharmaceutical companies. They discuss how they use mass photometry, and its benefits compared to SEC-MALS.

Accelerate mRNA characterization with nanogram-scale sensitivity
mRNA vaccines and therapeutics have become groundbreaking treatment platforms, but traditional analytical methods can’t keep pace with the speed and efficiency modern development and manufacturing demand. Refeyn’s mass photometry technology delivers rapid, multi-attribute insights into intact mRNA of any size – using only nanogram-level sample amounts.