
Meet the new gold standard for AAV analytics. Mass photometry offers AUC-quality data – but it's 300x faster and uses 2,000x less sample.
For adeno-associated virus (AAV) capsid analysis, the gold standard has changed. Mass photometry resolves empty, partially filled, full, and overfilled capsids with single-molecule precision. It runs 300x faster than analytical ultracentrifugation (AUC), with 2,000x less sample, and anyone can learn to use it in half a day. For this application, the case for mass photometry is clear.
AAV capsid analysis is one application among many, and AUC remains the right tool for others. This comparison explains how each method works, how they perform in the lab, and when each is the better fit.
Mass photometry is a rapid, light scattering technique that characterizes individual biomolecules by quantifying the interferometric patterns generated as particles land on a glass substrate. The resulting signal (termed ‘contrast’) scales linearly with molecular mass, providing single-molecule resolution without the need for labels or fixatives. Covering a mass range of 30 kDa to 6 Mda (depending on the system), mass photometry functions at low nanomolar concentrations, the system functions at low nanomolar concentrations, preventing surface overcrowding while capturing true equilibrium behavior in just minutes using a 10 µL droplet.
Since its introduction in 2018, mass photometry has become a favored multi-attribute method across biopharma and academia. It is used by 18 of the world’s top 20 biopharma companies, along with many CROs and CDMOs, and has been used in hundreds of peer-reviewed publications.
Mass photometry is widely leveraged to:
Evaluate macromolecular kinetics including:
Read our article: “How does mass photometry work?” to learn more.
Analytical ultracentrifugation (AUC) is a high-resolution hydrodynamic technique that characterizes biomolecules by observing their sedimentation behavior within a centrifugal field generated by high-speed centrifugation. Free from surface interactions or matrix interference, particles migrate through solution at rates strictly proportional to their molecular weight, conformation, and density. This migration is precisely captured via real-time optical tracking (absorbance, interference, or fluorescence). The method boasts an unmatched dynamic range spanning 1 kDa to 1 GDa, evaluating native-state equilibrium and heterogeneity across micromolar to nanomolar concentrations within a standard 400 µL sample cell.
Introduced in the early 1900s, AUC is established as a benchmark multi-attribute method for assessing sample purity and heterogeneity. While AUC experiments can be done as either an equilibrium or velocity-based experiment, sedimentation velocity (SV-AUC) is the more commercially applicable format because of its comparatively higher throughput and resolution of heterogeneous samples like complex AAV attributes (including partial and overfull capsids) and aggregated states of proteins (e.g., antibodies).
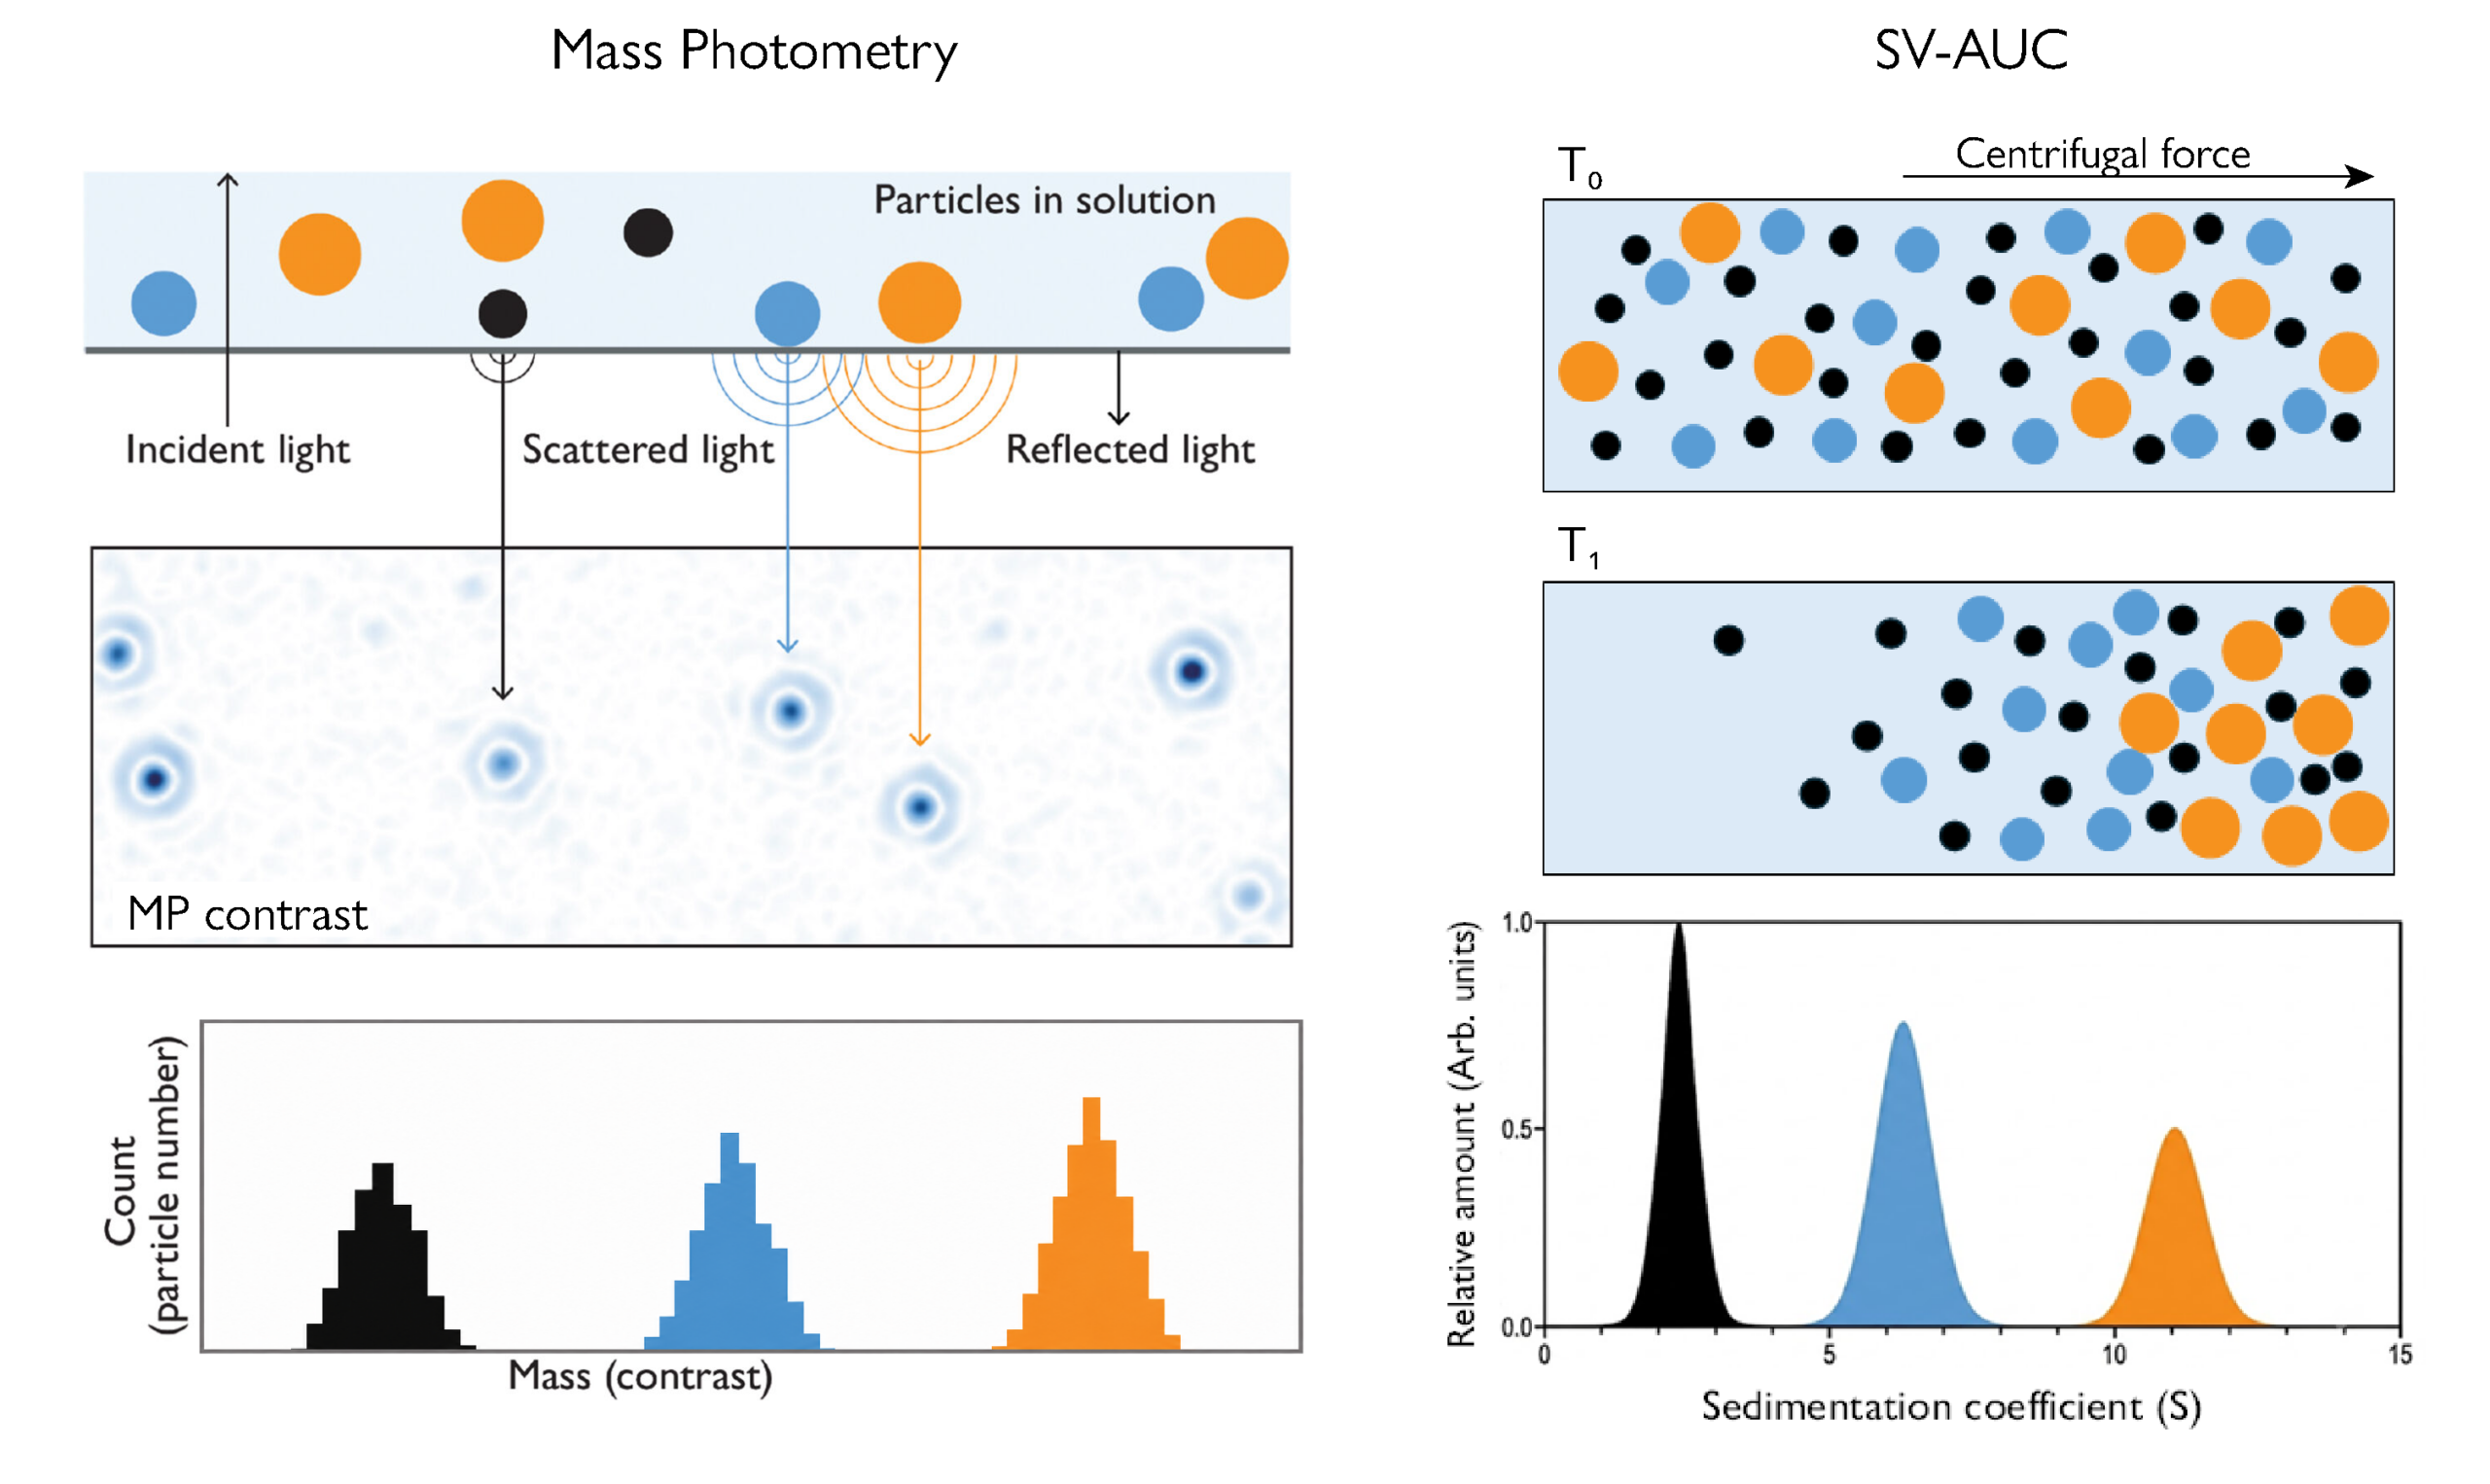
Figure 1. Schematic representations of mass photometry and SV-AUC experiments. (Left) mass photometry measures the mass of single particles in solution by analyzing the light they scatter as they land on the slide surface. This creates a contrast signal with an intensity proportional to their mass, represented here as small (black), medium (blue), or large (orange). From the measurement of thousands of particles, a histogram is created to reveal the particles’ mass distribution. (Right) In SV-AUC, particles are randomly distributed in solution at T0 . Upon centrifugation, they sediment at rates determined by their molecular weight, conformation, and density, leading to spatial separation by T1. Analysis of the sedimentation profiles yields a distribution of sedimentation coefficients.
Summary of differences
Here is an overview of the key differences between mass photometry and SV-AUC.
| Mass photometry | SV-AUC | |
|---|---|---|
|
Principle |
Measures the interferometric light scattering signal from individual molecules landing on a surface. The resulting signal is proportional to molecular mass. |
Separates sample components in a centrifugal field – based on particle mass, shape, and density. |
|
Output |
Mass distribution histogram
|
Sedimentation coefficient distribution |
|
Molecular resolution |
Single molecule |
Ensemble averages based on sedimentation velocity |
|
Label-free |
Yes |
Yes |
|
Measurement in native buffer |
Yes |
Yes |
|
Sample consumption |
10–20 µL, ~30 ng |
400 µL, ng-µg |
|
Analysis time |
1 min |
>6 hrs |
|
Measurement resolution |
Depends on mass, e.g. 25 kDa FWHM at 66 kDa |
Depends on experimental setup, but usually superior to mass photometry |
|
Particle mass range |
30 kDa – 5 MDa |
Depends on column, but can be ~ 10 kDa to multiple MDa |
|
Sample concentration |
Nanomolar (up to tens of micromolar if the MassFluidix HC microfluidic system is used) |
Micromolar |
|
Preparation steps |
Simple dilution; compatible with a wide range of buffers |
Thorough purification, buffer matching
|
|
Ease of use |
Simple to use; new users can be trained in half a day |
Requires specialist expertise for both ultracentrifuge operation and data interpretation |
Key differences in depth between mass photometry and AUC
Speed
Mass photometry measurements take one minute (up to five minutes including analysis time), while SV-AUC measurements take several hours. MP’s speed makes it better suited to time-sensitive applications, such as in-process sample characterization.
Sample preparation
Although SV-AUC sample preparation requires thorough purification and careful buffer matching, both SV-AUC and mass photometry are relatively easy to prepare, requiring only simple dilutions without immobilization, column interactions, or labelling.
Sample consumption
Mass photometry requires 10–20 µL of sample at nanomolar concentrations, while SV-AUC measurements consume around 400 µL of sample at micromolar concentrations. This means that mass photometry typically consumes around 20 times less volume at roughly 1,000 times lower concentration than SV-AUC (a difference on the order of 10,000 times less sample).
The low sample concentration required by mass photometry is an advantage when working with limited or precious material, but worth bearing in mind for low-affinity interactions or aggregation studies, where more dilute conditions can cause complexes to dissociate. For applications requiring higher concentrations, the MassFluidix™ HC microfluidics system extends MP’s working concentration range (from nanomolar up to the tens of micromolar).
Sample mass range
SV-AUC experiments can measure particles from a few kDa to the GDa range. In comparison, MP works on a range of 30 kDa to 6 MDa (different mass photometers have slightly different mass measurement ranges). A related technology, macro mass photometry, can be applied to larger particles like adenovirus, lentivirus, or VLPs.
Information reported
Mass photometry delivers information via mass distribution histograms that display each detected particle landing event and its corresponding mass. The different species present in the sample cluster together in the histogram around their molecular weight values, forming peaks that can be fitted with a Gaussian (Fig. 1).
In contrast, SV-AUC delivers a plot quantifying different groups of particles in the sample according to their sedimentation rates in solution under centrifugal force, measured as concentration-dependent detector signals (Fig. 1). These sedimentation rates are dependent on the hydrodynamic properties of the measured molecules, which in turn are highly dependent on the molecule’s size and shape.
Resolution
Overall, SV-AUC is better able to resolve (distinguish) distinct species than mass photometry. However, a key difference between the two techniques is that SV-AUC is a bulk technique: It monitors the collective sedimentation of groups of molecules with similar size and shape. This is relevant because, due to how optical detection methods such as UV absorbance work, the bulk output of SV-AUC is a mass ratio of the species present in the sample, which, in practice, means that without correcting for the extinction coefficient, SV-AUC results tend to be biased towards larger particles (Fig. 2).
In comparison, mass photometry performs a single-molecule measurement of interferometric contrast, producing a mass distribution and quantifying individual landing events. As a result, mass photometry measurements directly output the molar ratios of the different species present in the sample regardless of their masses (Fig. 2). As biomolecules tend to function based on their molar rather than their mass concentration, the molar concentration tends to be a more intuitive measure.
This limitation of SV-AUC can most of the time be worked around by using molar extinction coefficients to convert absorbance profiles into molar ratio readouts.
However, sometimes the extinction coefficients are not known, or the molecules that form a given peak have different molar extinction coefficients. In these cases, the direct mass readout provided by mass photometry can be an advantage, especially when it comes to detecting low-abundance populations or resolving very heterogeneous samples.
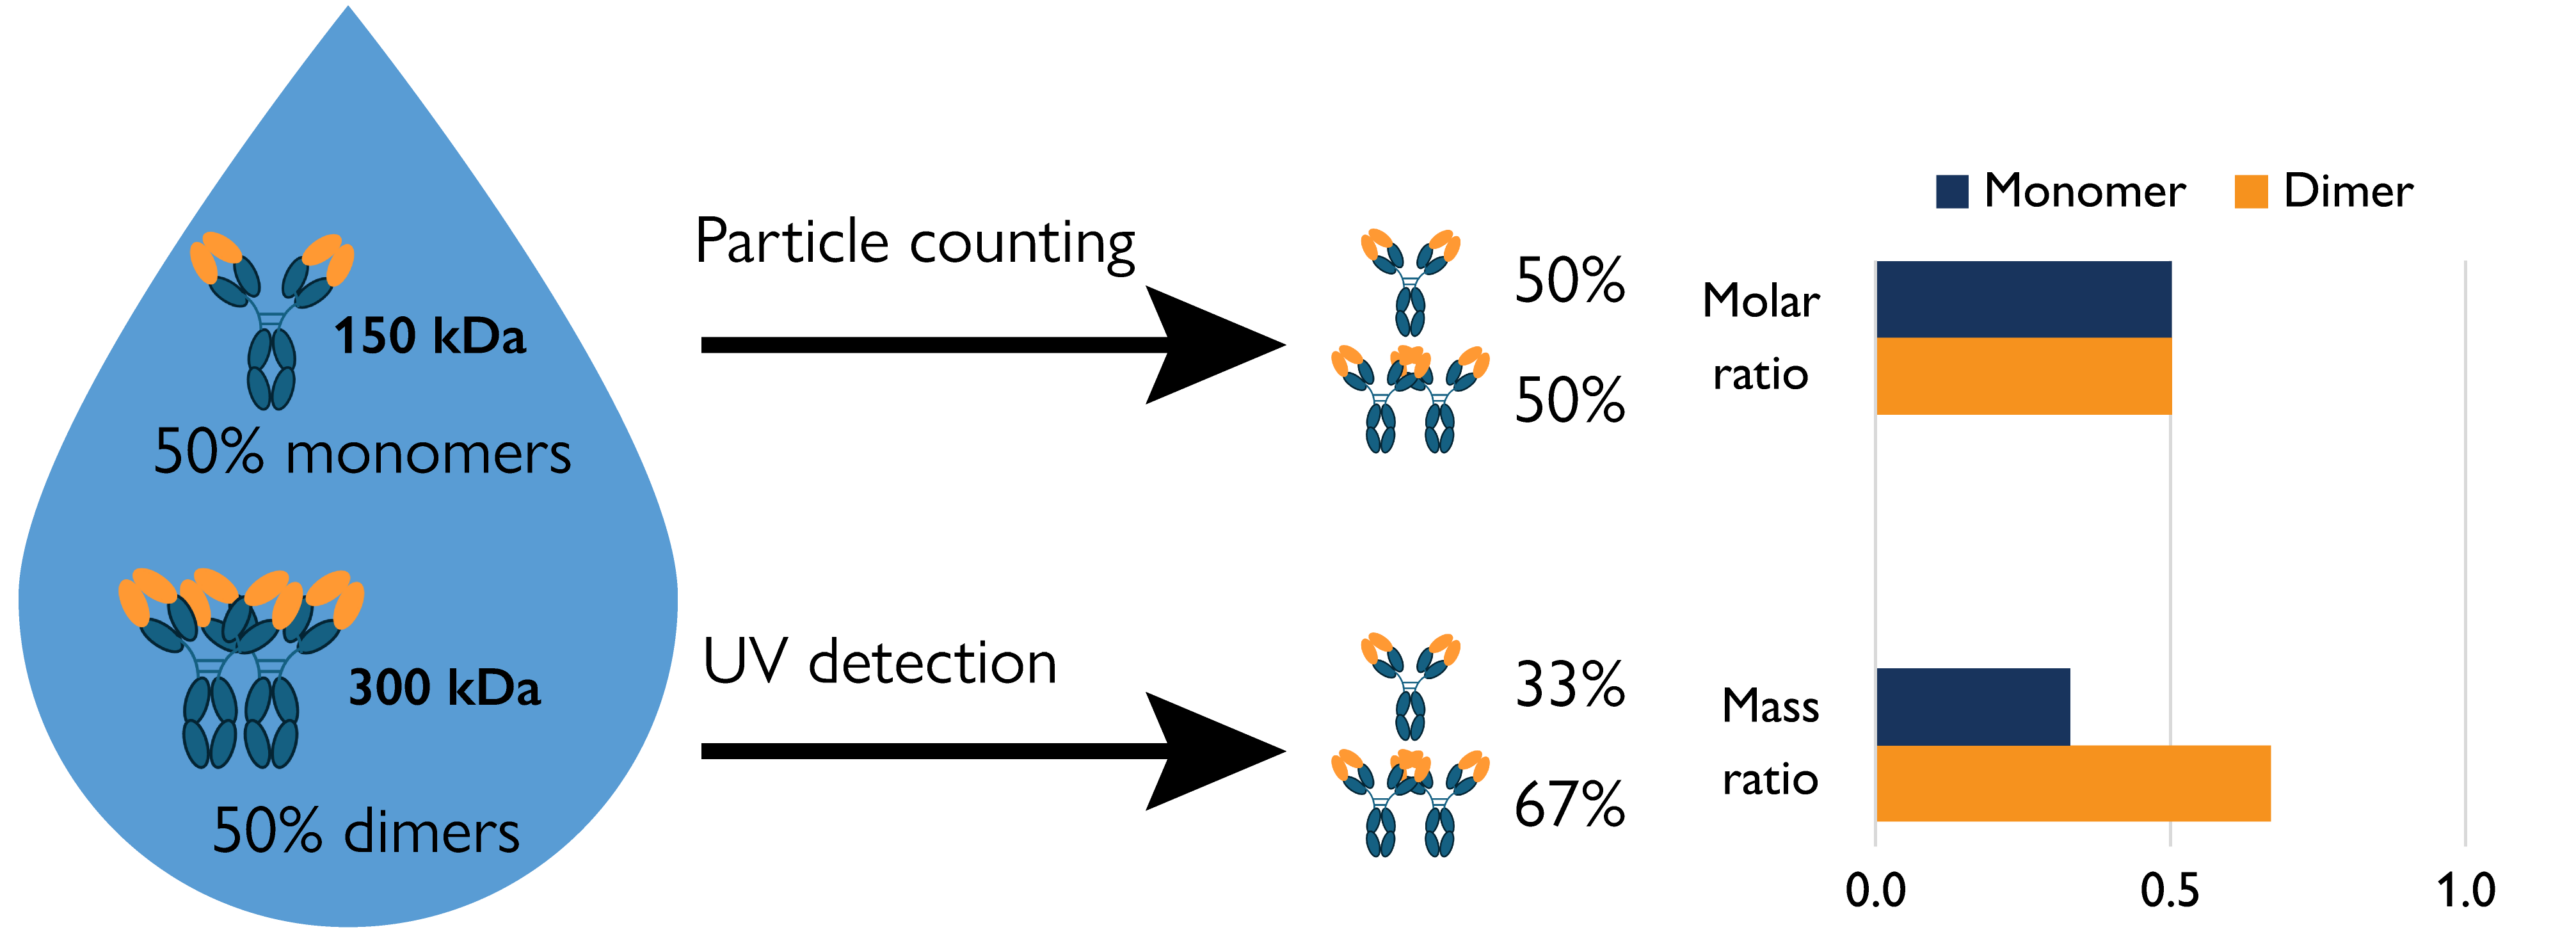
Figure 2. Mass photometry vs. SV-AUC: Mass photometry reports the molar ratio while SV-AUC reports the mass ratio. Particle-counting methods (such as mass photometry) report the molar ratio of different species present in a sample, while UV absorbance methods (such as SV-AUC) report the mass ratio. As this example shows, dimers produce twice the signal of the monomers when UV absorbance is measured, due to their having double the mass.
Why scientists choose mass photometry

"Mass photometry works well with all the AAV serotypes that we tested, and its minimal sample volume and concentration requirements are impressive compared to traditional methods like AUC or cryoTEM."
- Product: TwoMP Mass Photometer
- Location: Jiangyin City (China)


“We use mass photometry in our lab to provide clients with fast, easily generated, and readily interpretable data to support drug development. Mass photometry is particularly useful in early-phase and formulation screening, and as an orthogonal technique to sedimentation velocity AUC for size distribution characterization.”
- Product: SamuxMP Mass Photometer
- Location: Louisville, Colorado, USA


“We chose mass photometry for its super-fast turnaround time and minimal sample requirements – compared to methods like AUC. It allows us to rapidly quantify AAV full-to-empty ratios and determine the proportion of AAV particles during purification.”
- Product: SamuxMP Mass Photometer
- Location: Rockville, Maryland, USA


“We are continuously expanding our AAV testing portfolio to meet the evolving needs of our customers. One notable gap was the ability to analyze empty/full AAV particles. Due to the complexity of the current golden standard methods, like analytical ultracentrifugation (AUC) and electron microscopy, we quickly recognized the revolutionary potential of mass photometry when it came into play. The data quality closely matched that of the gold standards. So we decided to incorporate mass photometry into our service portfolio.”
- Product: SamuxMP Mass Photometer
- Location: Leiden, Netherlands

“Refeyn’s instruments offer an easy-to-use platform that delivers rapid results with performance comparable to gold standard assays, all at a competitive price point.We considered SEC-MALS, AUC and CDMS, but ultimately chose mass photometry for its speed, simplicity, and ability to deliver high-quality AAV characterization with minimal sample requirements."
- Product: SamuxMP Mass Photometer
- Location: Carlsbad, California, USA

- Webinar
Mass Photometry Masterclass Series: Harnessing the power of mass photometry to accelerate AAV analysis
Find out why mass photometry is becoming the go-to choice for AAV analysis in this Mass Photometry Masterclass.
Mass photometry is recognized by regulatory authorities
Mass photometry, enabled by GMP-compliant software, is increasingly being recognized by leading regulatory bodies as a robust, reliable method for characterizing AAVs and gene therapy products. Using GMP-compliant software ensures that critical quality attribute (CQA) measurements are fully auditable and suitable for regulated workflows.
In recent years, authorities in Europe, Asia, and North America have highlighted mass photometry’s value in assessing CQAs such as empty, partially-filled, full and overfilled capsids in rAAV products. These endorsements underscore mass photometry’s growing role globally in process development, quality control, and at-line monitoring for advanced therapies.
The ISO standard for Biotechnology – Gene Delivery Systems (16921-2), published in 2026, specifies minimum requirements for quantifying viral vectors in terms of physical titer and their associated activity. It lists mass photometry as an approved method for determining AAV capsid content.

USP Headline?
In 2025, the U.S. Pharmacopeia (USP) recognized mass photometry as a method to measure empty, full and partial capsids in rAAV products in their chapter, <1067> Best Practices for the Manufacture and Quality Control of Recombinant Adeno-Associated Virus Gene Therapy Products.
https://doi.usp.org/USPNF/USPNF_M19095
They introduced AAV8 (Empty Capsids) and AAV8 (Full Capsids) reference standards, using mass photometry alongside CD-MS and AUC to characterize the percentages of empty, full, and partially filled capsids in the standards.
Application note – AAV8 Reference Standards: revolutionizing empty/full capsid analysis
The USP also included mass photometry in its Gene Therapy Analytical Guide in 2025, for analysis of the Product Purity CQA Capsid Content (Empty/Full).
https://genetherapyanalyticalguide.usp.org/process-product-characterization/301

Headline 2?
In 2025, China’s National Institutes for Food and Drug Control, which ensures the safety and quality of drugs, published a journal article presenting mass photometry as a ‘robust method for characterizing AAV CQAs’.

Headline 3?
In 2024, the British Pharmacopeia included mass photometry in its Advanced Therapy Medicinal Products (ATMP) Guidance on Characterisation of the Capsid Particle Population in rAAV Products. In its section on empty/full characterization methods, it describes mass photometry as a “viable option for at-line process monitoring.”
Case studies
AAV content characterization
AAV capsid content – the proportions of empty, partially filled, full, and overfilled capsids in a sample – is a critical quality attribute for AAV manufacturing and process development. SV-AUC is one of the main techniques currently used to characterize the capsid content of AAV samples, as it can quantify the proportions of the differently loaded capsids with high accuracy.
However, SV-AUC runs take several hours and consume large amounts of sample, making frequent or in-process monitoring impractical in fast-moving process development workflows. The technique also requires specialist expertise and expensive instrumentation, meaning analysis is often outsourced – adding further delays.
In one paper, Wagner and colleagues directly compared the results of MP and SV-AUC when measuring the capsid content distribution of AAV samples. They found that the two techniques produced very similar results (Fig. 4) and highlighted the practical advantages of mass photometry’s low turnaround times and sample consumption, as well as its ease of use. The authors concluded that mass photometry shows great potential to quickly assess unwanted byproducts – empty, partially filled, and overfilled capsids – alongside full capsids, offering a more user-friendly and less laborious alternative to AUC with implications for patient safety in gene therapy.
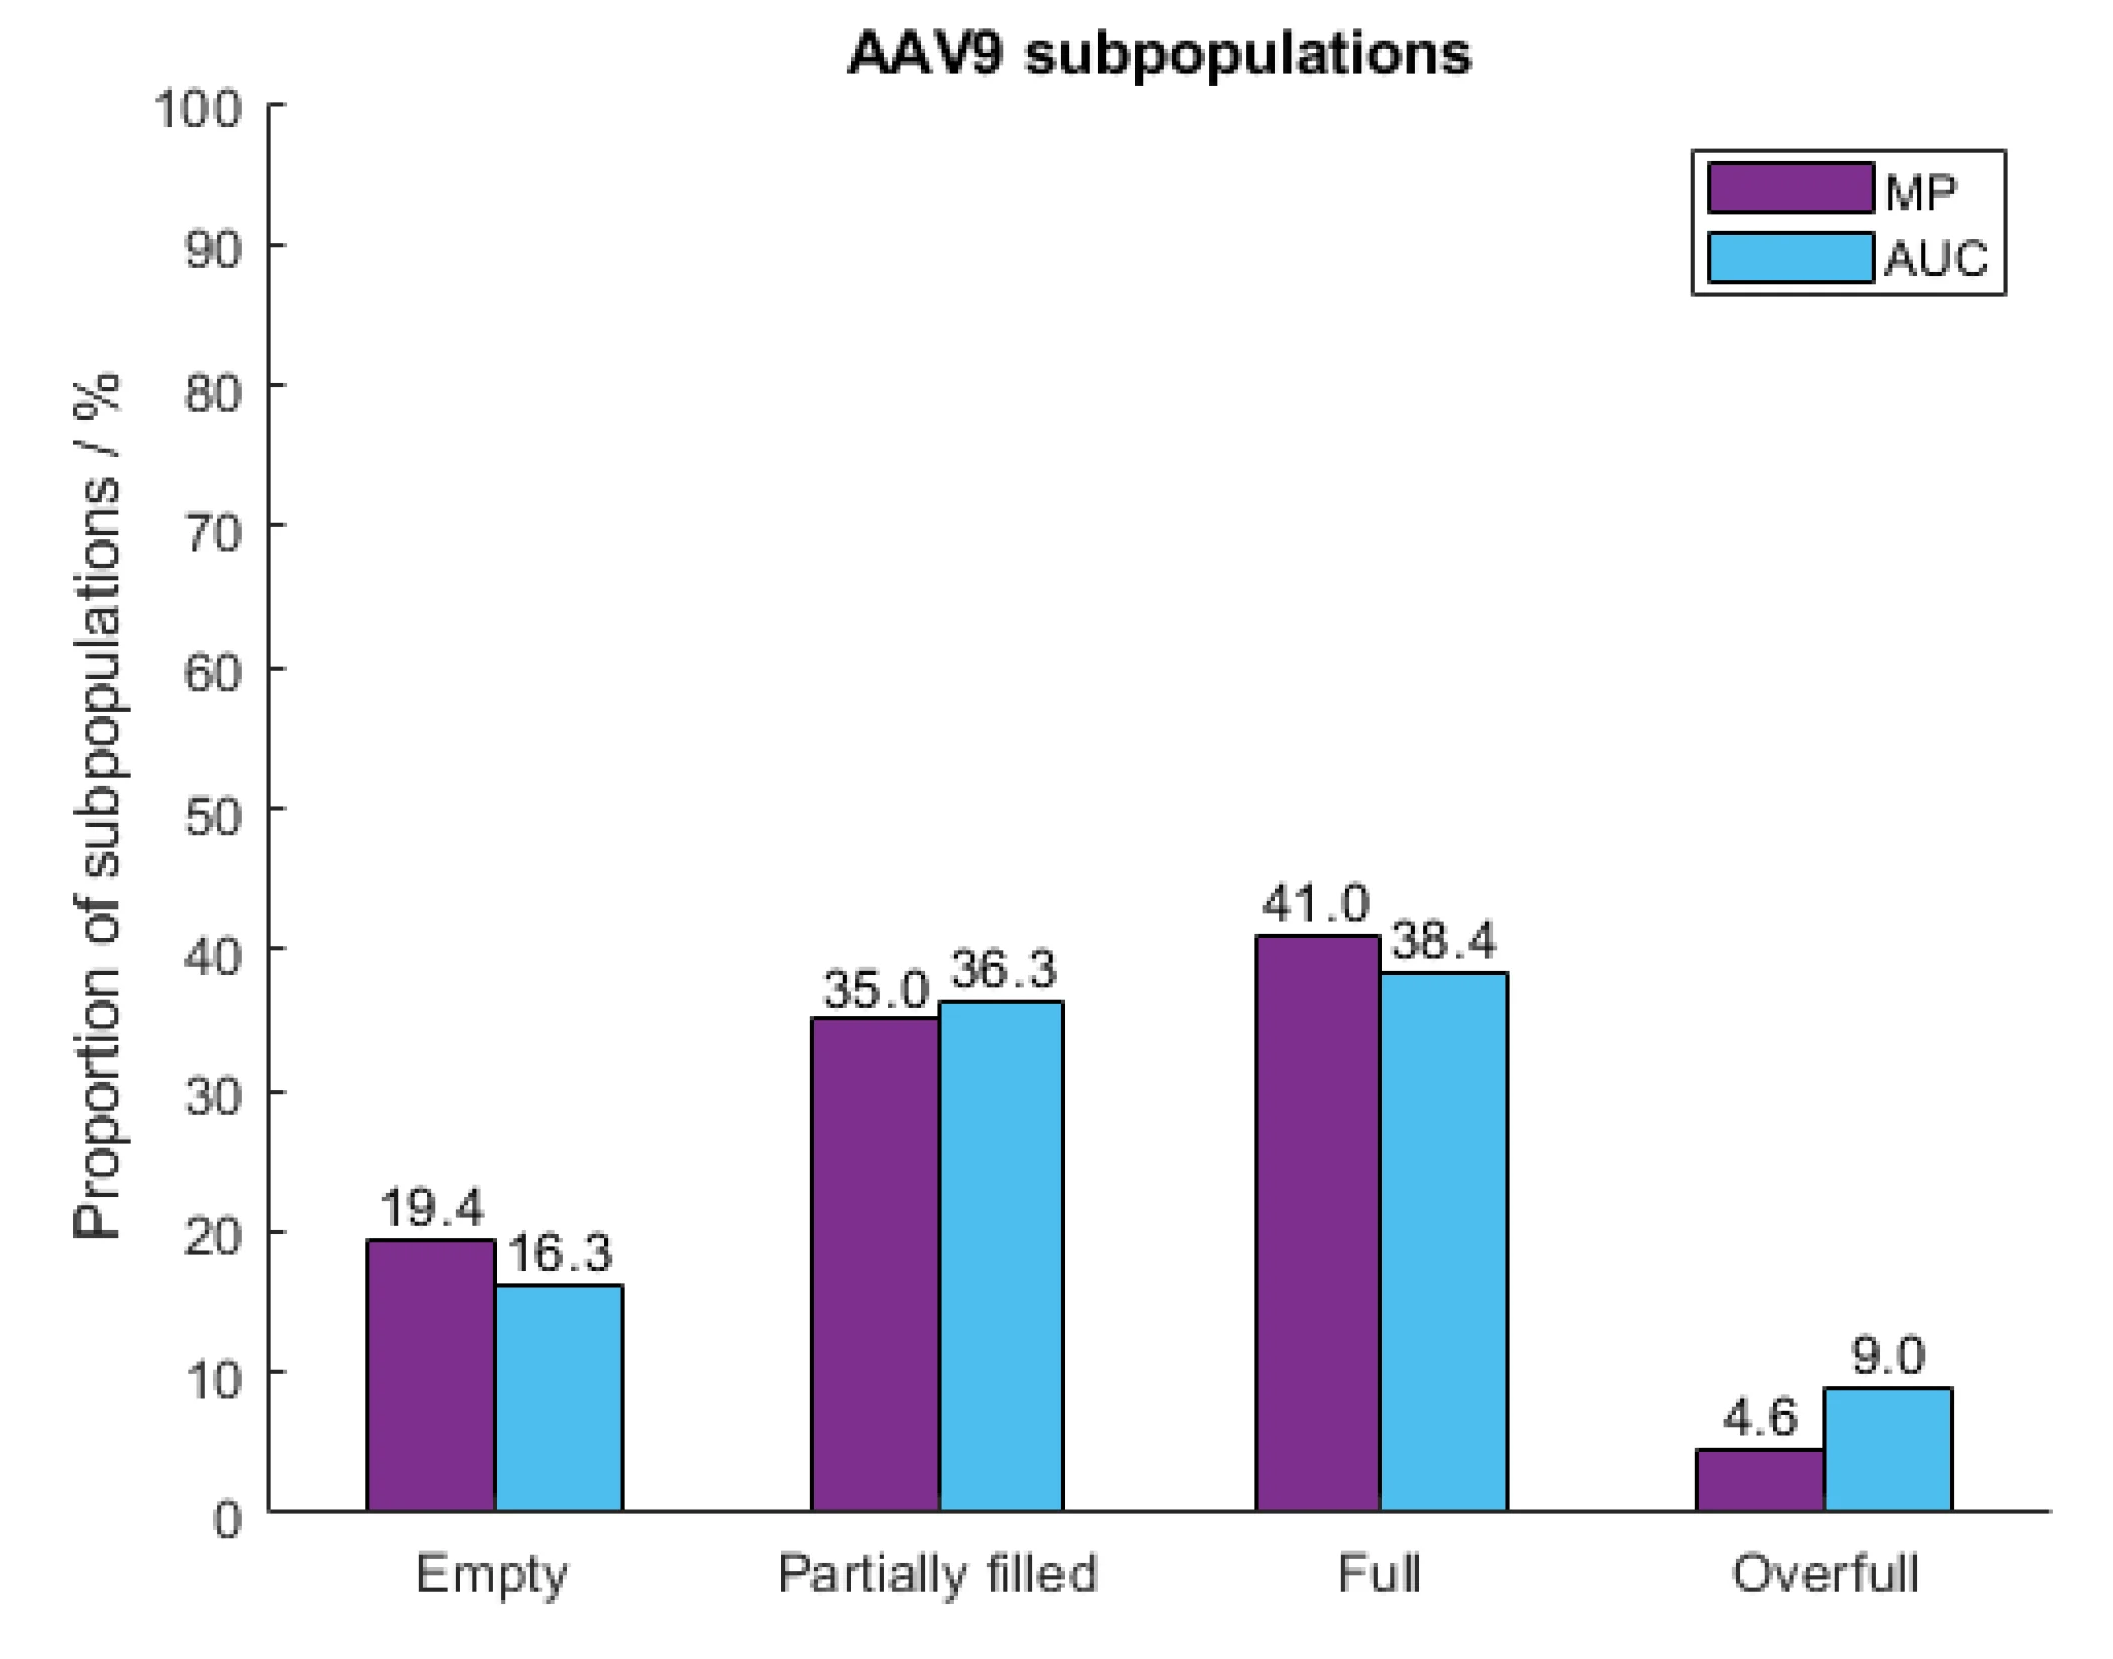
Figure 3. Quantifying empty, full, partially filed, and overfilled AAVs with mass photometry (MP) and SV-AUC. Wagner et al. found that the two techniques showed broad agreement on the relative proportions of each species present in the sample. Mass photometry measurements were performed on a Samux® mass photometer. The authors concluded that MP shows great potential to quickly assess unwanted byproducts – empty, partially filled, and overfilled capsids – alongside full capsids, offering a more user-friendly and less laborious alternative to AUC with implications for patient safety in gene therapy.
Monoclonal antibody aggregation
To assess these differences in practice, we used mass photometry and SV-AUC to measure NISTmAb – a monoclonal antibody reference standard widely used to benchmark and compare analytical techniques – under control and heat-stressed conditions. Both techniques detected a main peak corresponding to monomeric antibody, as well as an increase in aggregates in the heat-stressed sample. However, while peaks for NISTmAb dimers, trimers, and tetramers were all clearly visible in the mass histogram (Fig. 3A), SV-AUC only clearly resolved the monomer, dimer, and trimer populations (Fig. 3B). These differences occur due to the bulk nature of SV-AUC measurements, as well as its sensitivity to particle shape, which is highly variable in larger antibody aggregates.
For more information on how mass photometry performs when measuring antibody aggregation, read the full technical note.
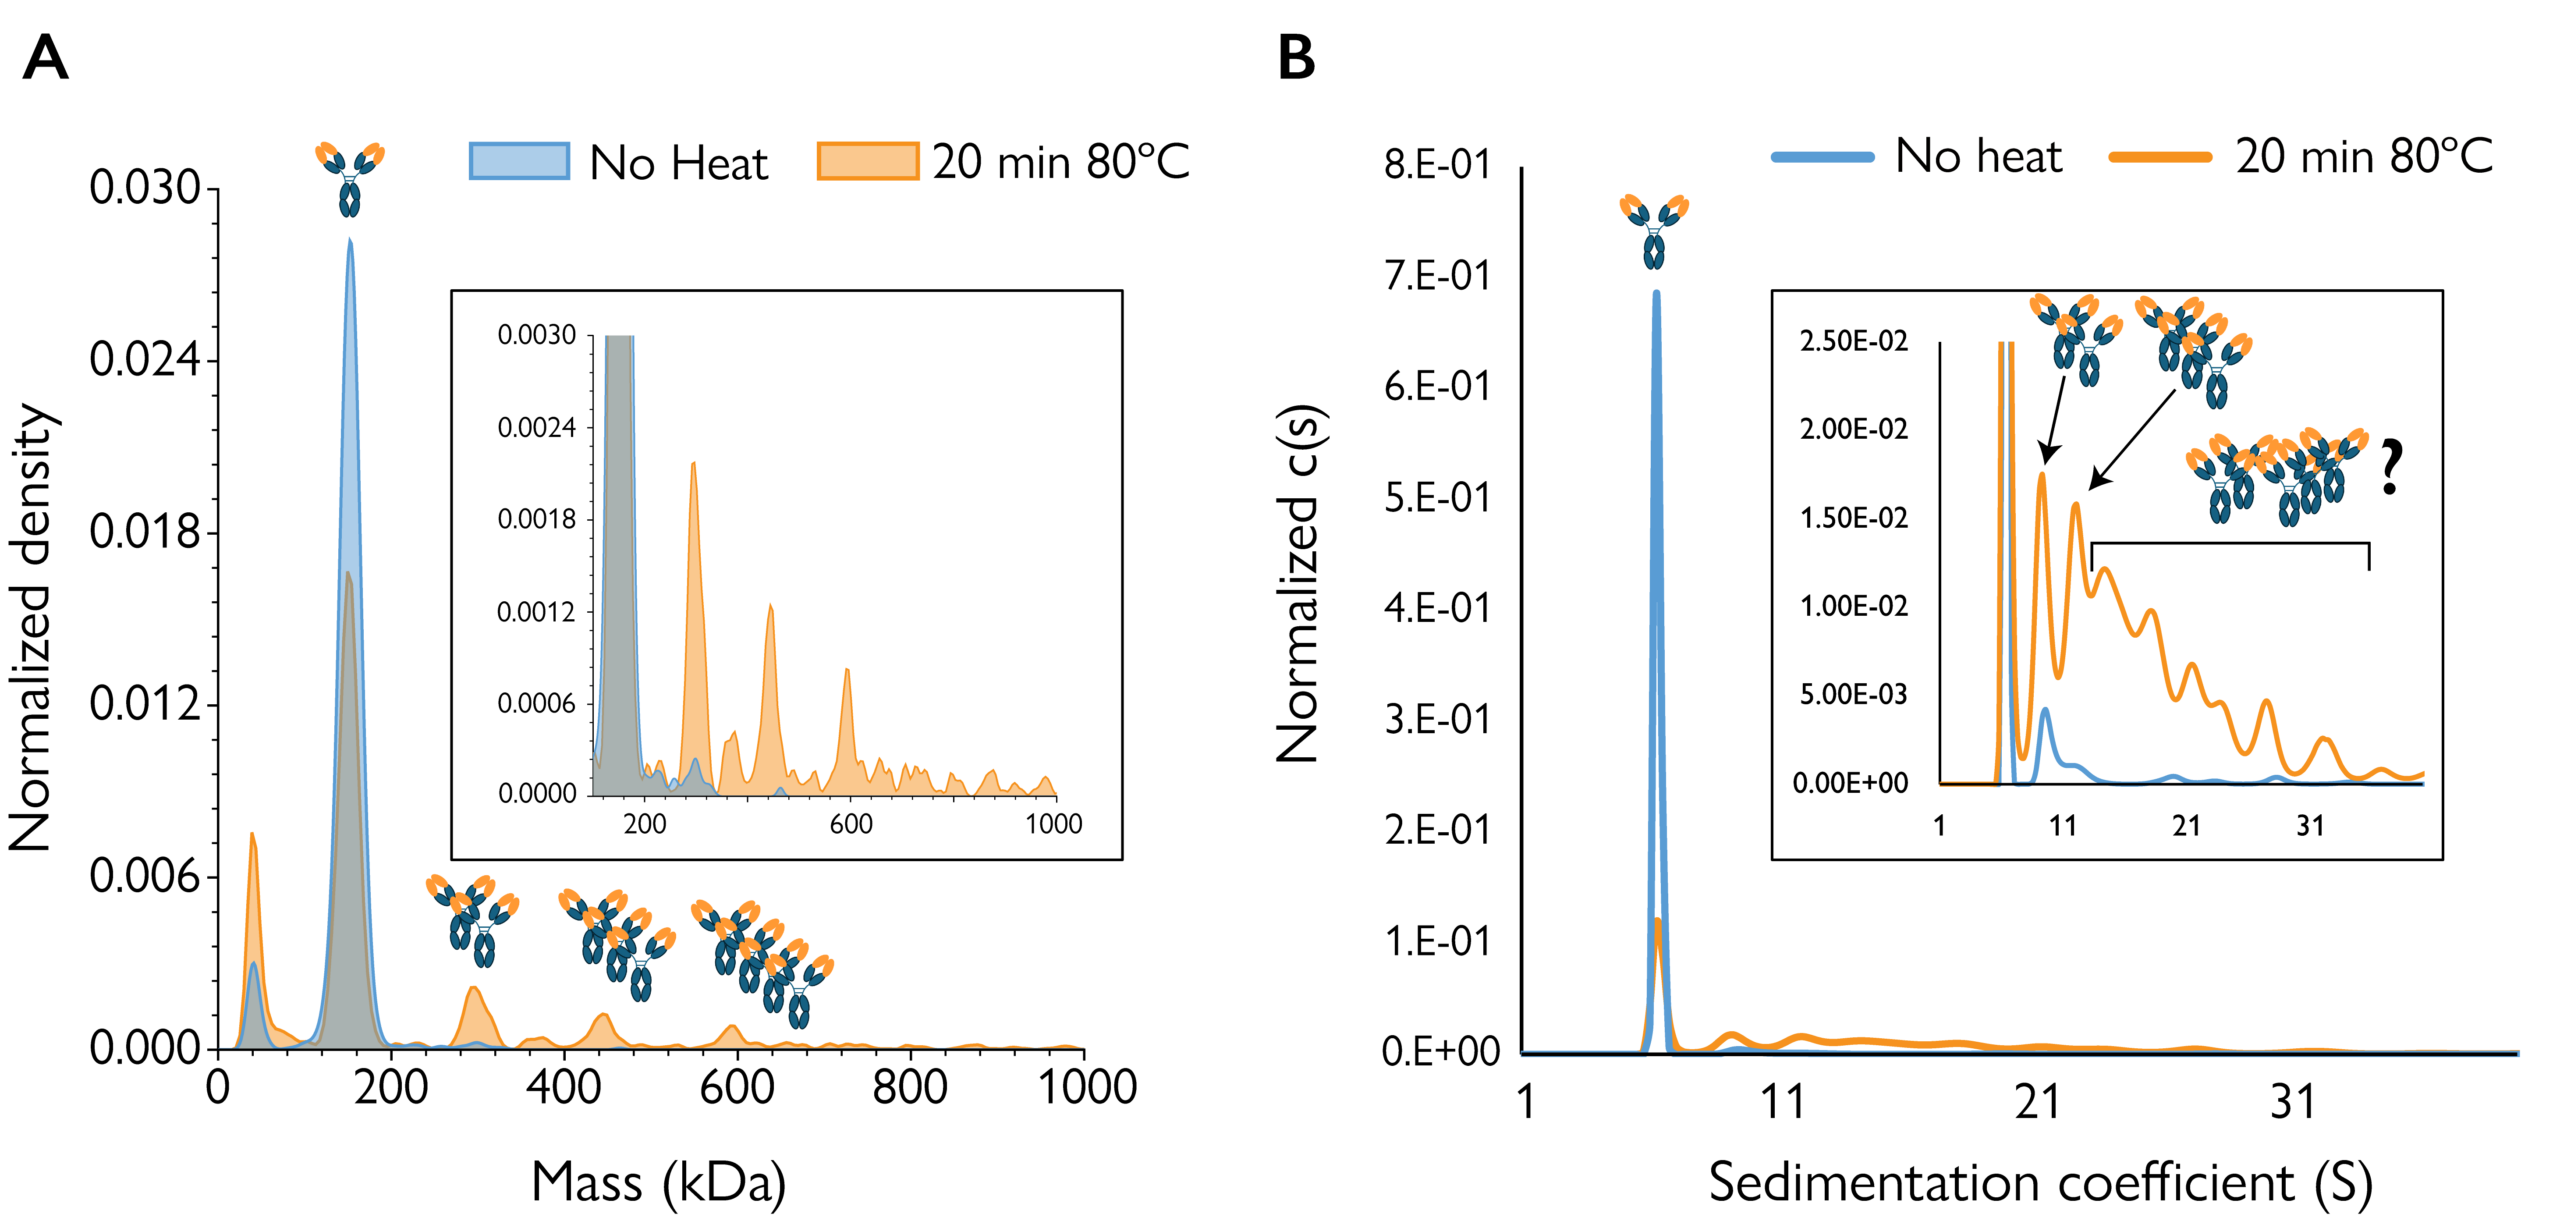
Figure 4. Mass photometry resolved more aggregate NISTmAb species than AUC. Samples of heat-stressed NISTmAb (20 minutes at 80° C; orange traces) and control NISTmAb (no heat; blue traces) were measured by (A) MP, inset zooms in on aggregate peaks, and (B) AUC, inset zooms in on aggregates. In each case, a single measurement is shown. Mass photometry measurements were performed on a TwoMP mass photometer.
Publications comparing AUC and MP
Academic literature
Quantification of Empty, Partially Filled and Full Adeno-Associated Virus Vectors Using Mass photometry
“The great potential of mass photometry to quickly assess unwanted byproducts (empty, partially filled, and overfilled AAV particles) in an AAV sample alongside the desired full AAV capsids could provide a more user-friendly and less laborious alternative to AUC in the future and allows to make gene therapy products safer for patients.”
Biophysical Analysis of Vip3Aa Toxin Mutants Before and After Activation
Mass photometry as a robust method for characterizing adeno-associated virus critical quality attributes in gene therapy vector
Orthogonal Approaches to AAV Vector Characterization: Validating Quantitative TEM for Partially Filled Particles
Comparative analysis of empty and full adeno-associated viruses under stress conditions by anion-exchange chromatography, analytical ultracentrifugation, and mass photometry
Studies by CROs and CDMOs
AAV Vector Characterization: Analytical Methods for Full, Empty and Partial Capsid Ratio Assessment
Tools for AAV Capsid-Content Characterization – Comparing Sedimentation-Velocity Analytical Ultracentrifugation and Mass Photometry
Transforming AAV Capsid Analysis With Single Particle Analysis Using Mass Photometry
Mass Photometry and AUC
Explore further resources
Measurement of NISTmAb aggregation with mass photometry, AUC, and DLS
Aggregation analyses of the antibody standard NISTmAb using mass photometry (MP), analytical ultracentrifugation (AUC), and dynamic light scattering (DLS).
Trusted at single-particle resolution: Mass photometry for AAV capsid content analysis
Watch this on-demand webinar to learn how mass photometry (MP) quantifies AAV capsid populations without labels, using minimal sample and delivering results in minutes. You’ll also see how MP data compares with analytical ultracentrifugation (AUC).
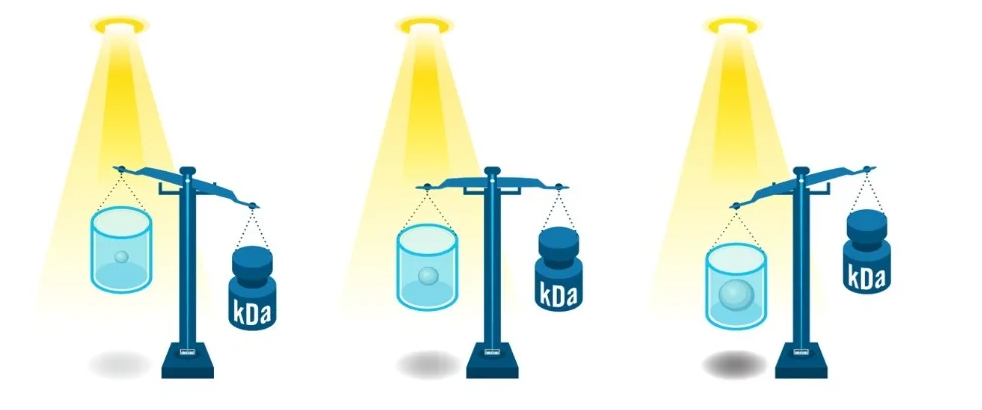
How does mass photometry work?
Mass photometry is a bioanalytical technology that measures the mass of individual biomolecules or particles in solution by quantifying light scattering.

Mass Photometry vs. Size-Exclusion Chromatography (SEC)
Beyond AUC, SEC is another popular analytical technique with many applications that overlap with mass photometry. Check out this in-depth comparison to learn the pros and cons of each technique.
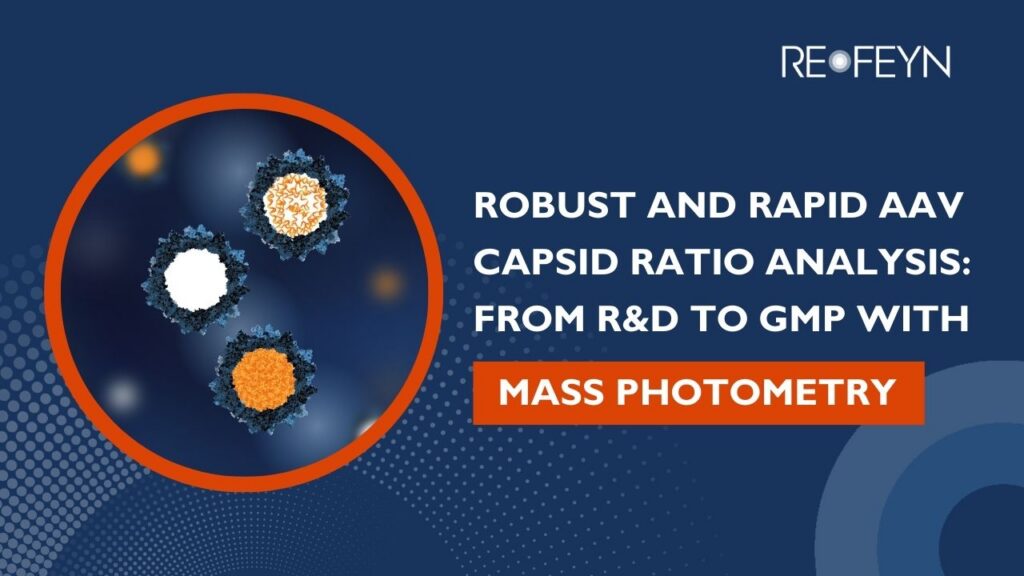
Robust and Rapid AAV Capsid Ratio Analysis: From R&D to GMP
In this on-demand webinar, discover how mass photometry offers a fast, simple, and highly effective alternative – delivering precise empty-to-full capsid ratio measurements in minutes with minimal sample requirements and no sample prep.
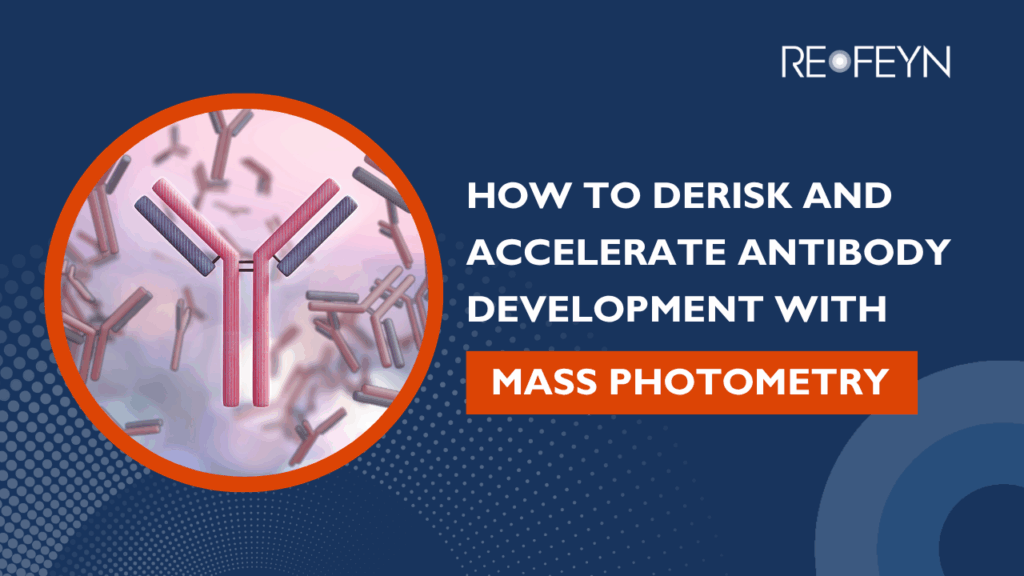
How to derisk and accelerate antibody development: Column-free analysis with mass photometry
In this webinar, we compare the performance of mass photometry and SEC-HPLC in the determination of antibody purity and aggregation in different antibody formats, and we delve into antibody-antigen binding mechanisms of mAbs and bsAbs. We show how mass photometry can measure binding stoichiometry and binding affinities associated with the different stoichiometries.
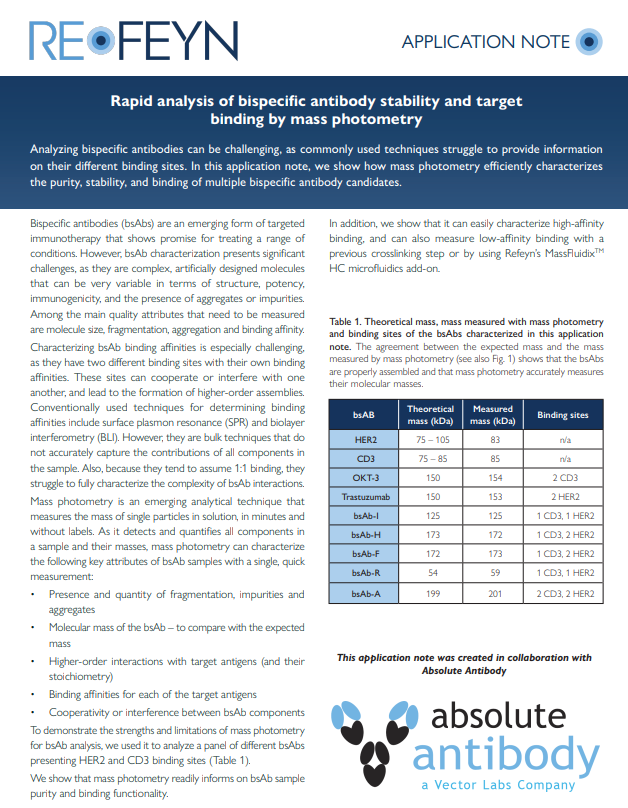
Rapid analysis of bispecific antibody stability and target binding by mass photometry
Analyzing bispecific antibodies can be challenging, as commonly used techniques struggle to provide information on their different binding sites. This application note shows how mass photometry efficiently characterizes the purity, stability, and binding of multiple bispecific antibody candidates. The app note was created in collaboration with Absolute Antibody.
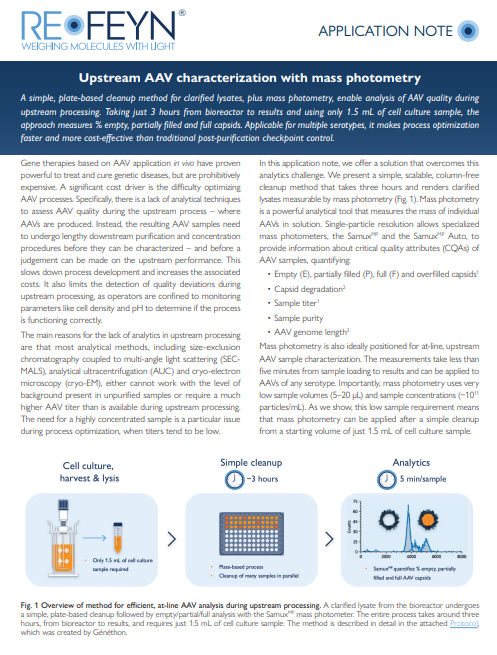
Upstream AAV characterization with mass photometry: Application note and Protocol
This application note and protocol describe a simple, plate-based cleanup method for clarified lysates, plus mass photometry. This approach enables analysis of AAV quality during upstream processing. Applicable for multiple serotypes, it makes process optimization faster and more cost-effective than traditional post-purification checkpoint control.

Comparing analytical approaches for AAV characterization
Explore the evidence for how mass photometry compares to other frequently used AAV analytics methods, including EM, AUC, CDMS, qPCR/ELISA, and SEC-MALS.
Discover the difference between mass photometry and AUC for yourself
For adeno-associated virus (AAV) capsid analysis, the gold standard has changed. Mass photometry resolves empty, partially filled, full, and overfilled capsids with single-molecule precision. It runs 300x faster than analytical ultracentrifugation (AUC), with 2,000x less sample, and anyone can learn to use it in half a day. For this application, the case for mass photometry is clear.
AAV capsid analysis is one application among many, and AUC remains the right tool for others. This comparison explains how each method works, how they perform in the lab, and when each is the better fit.